[Categorical data analysis] Assignment(1)
패키지 설치된 패키지 접기/펼치기 버튼
#install.packages("kableExtra")
#install.packages("dplyr")
#install.packages("car")
#install.packages("ggplot2")
library('kableExtra')
library('dplyr')
library('car')
library('ggplot2')
Q-1
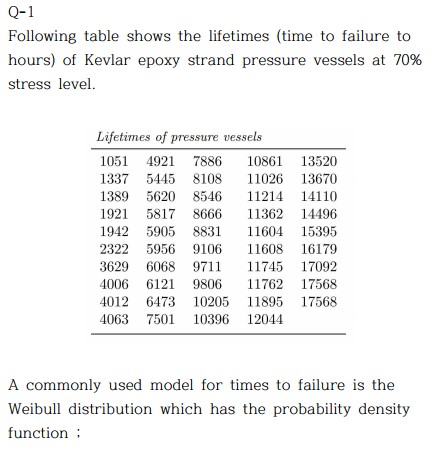
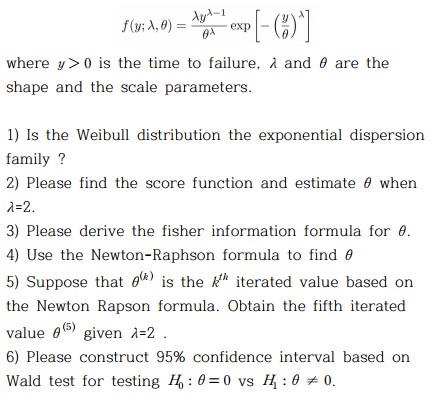
Q-1 1)
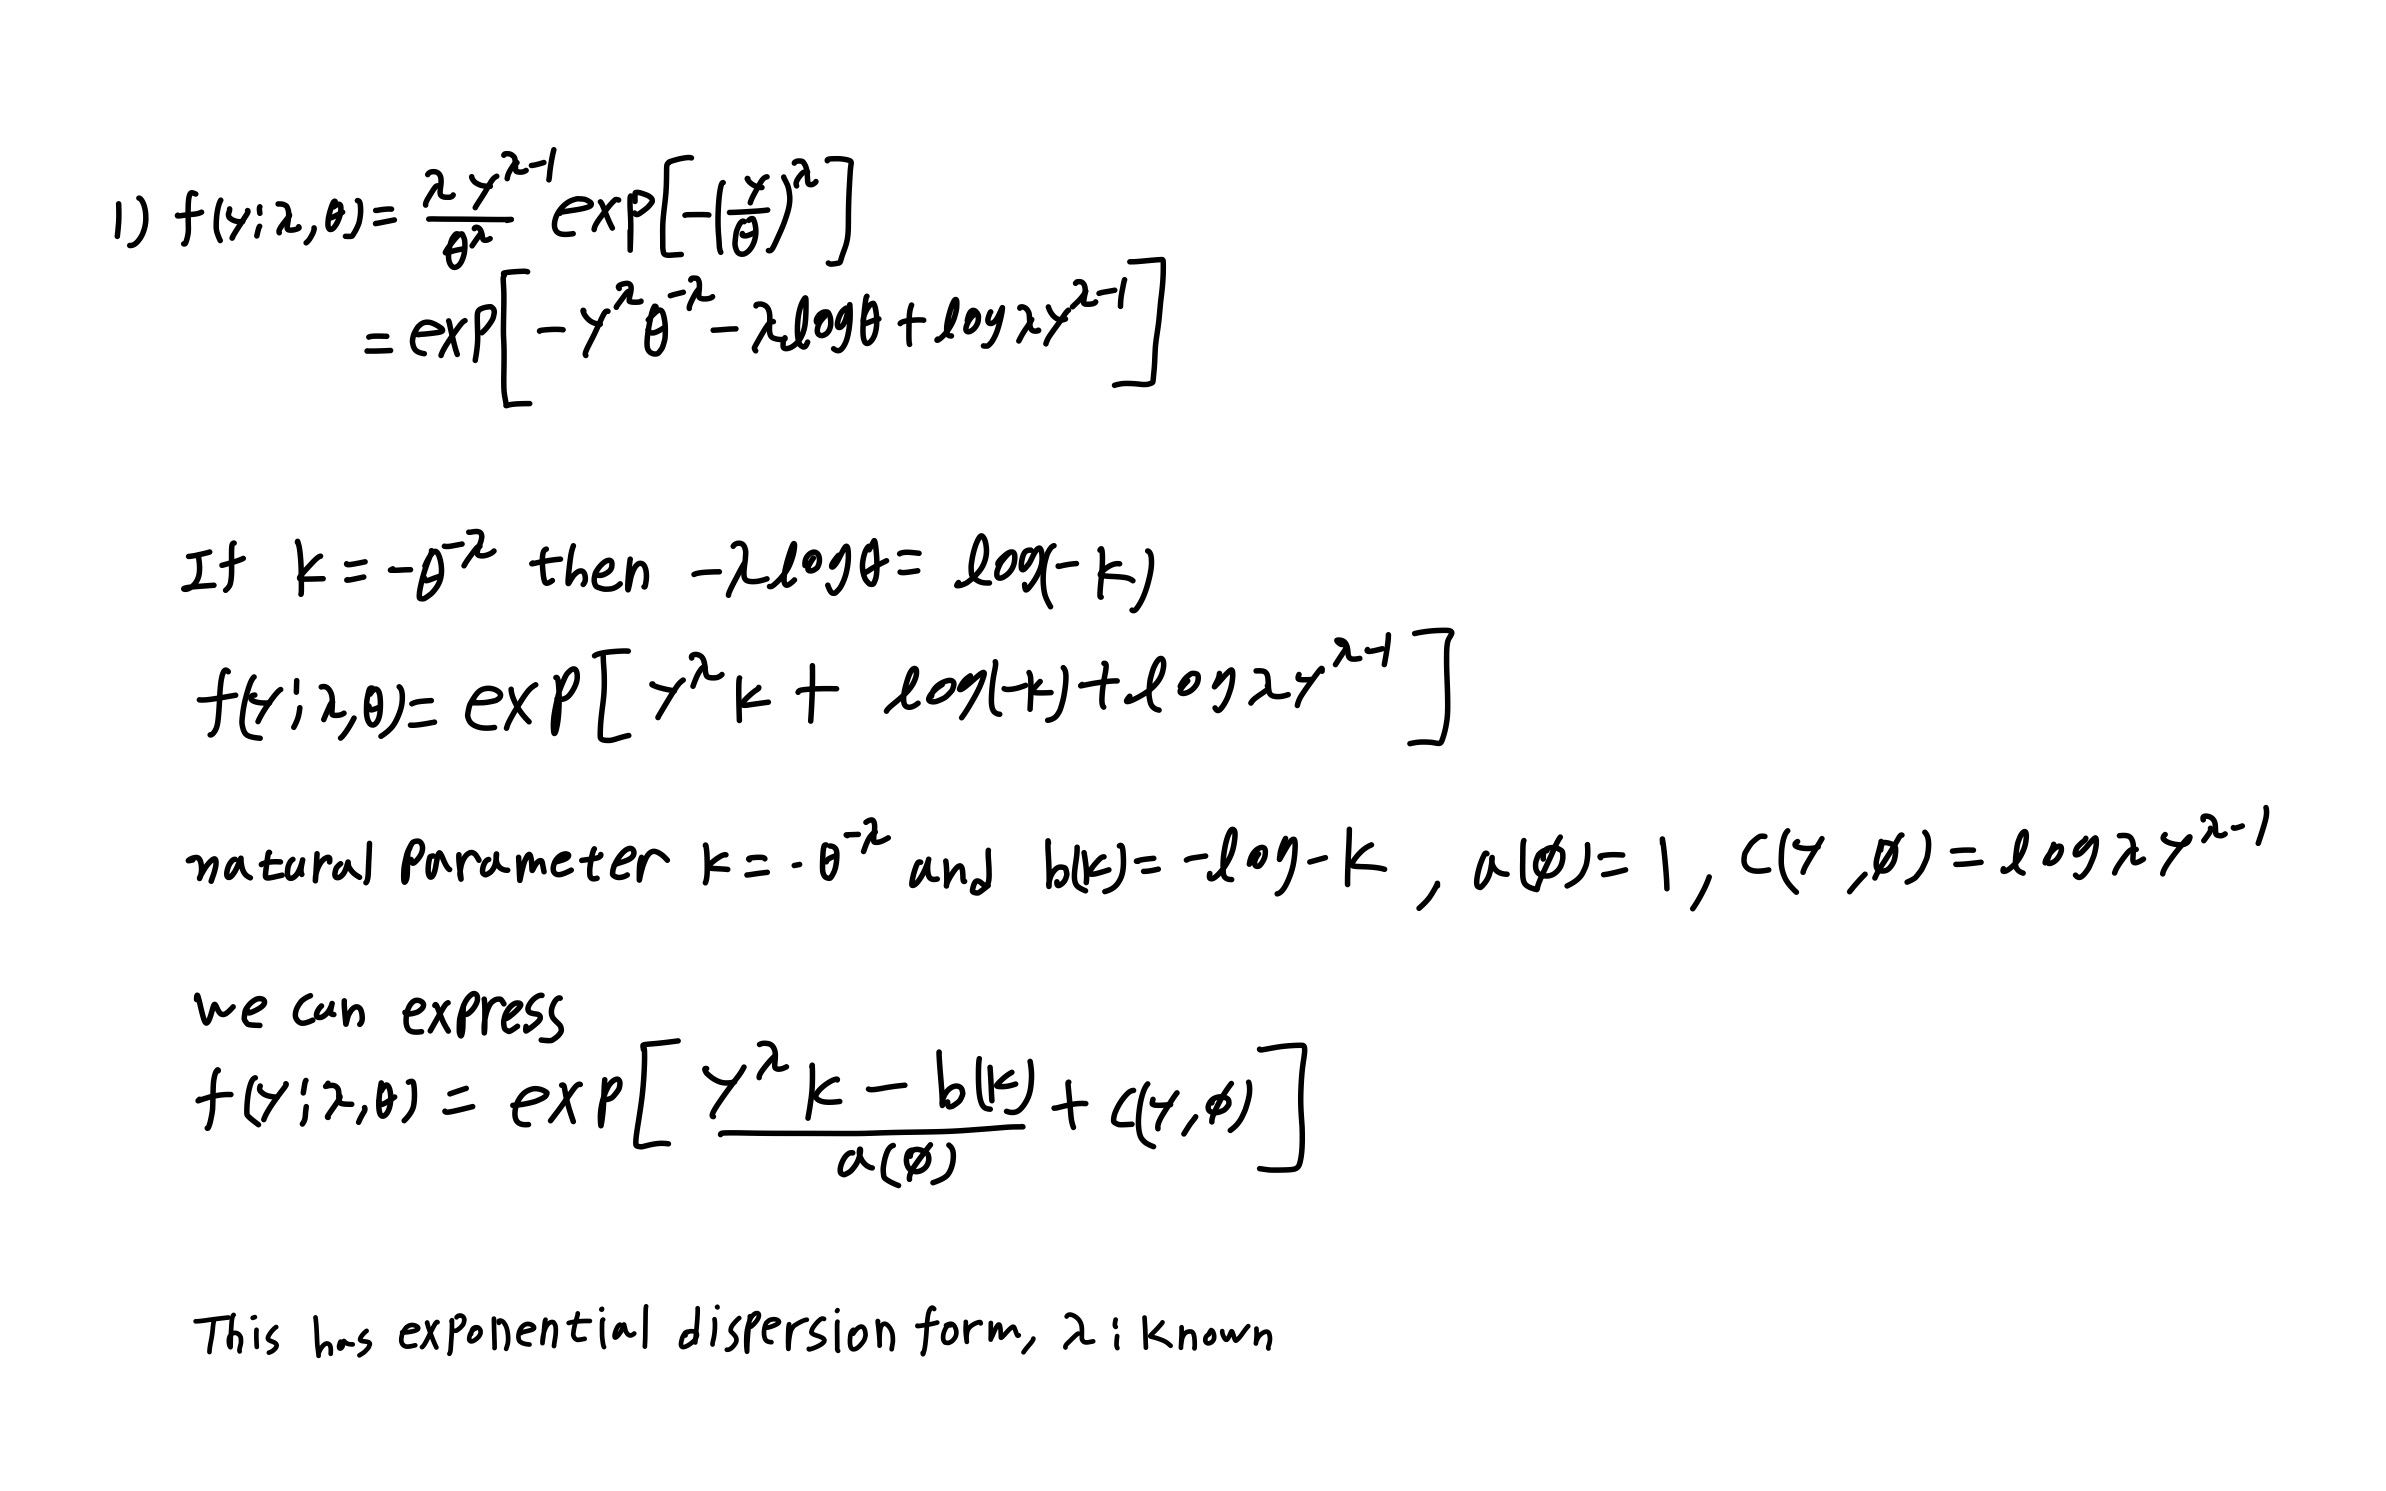
1) Is the Weibull distribution the exponential dispersion family?
Q-1 2)
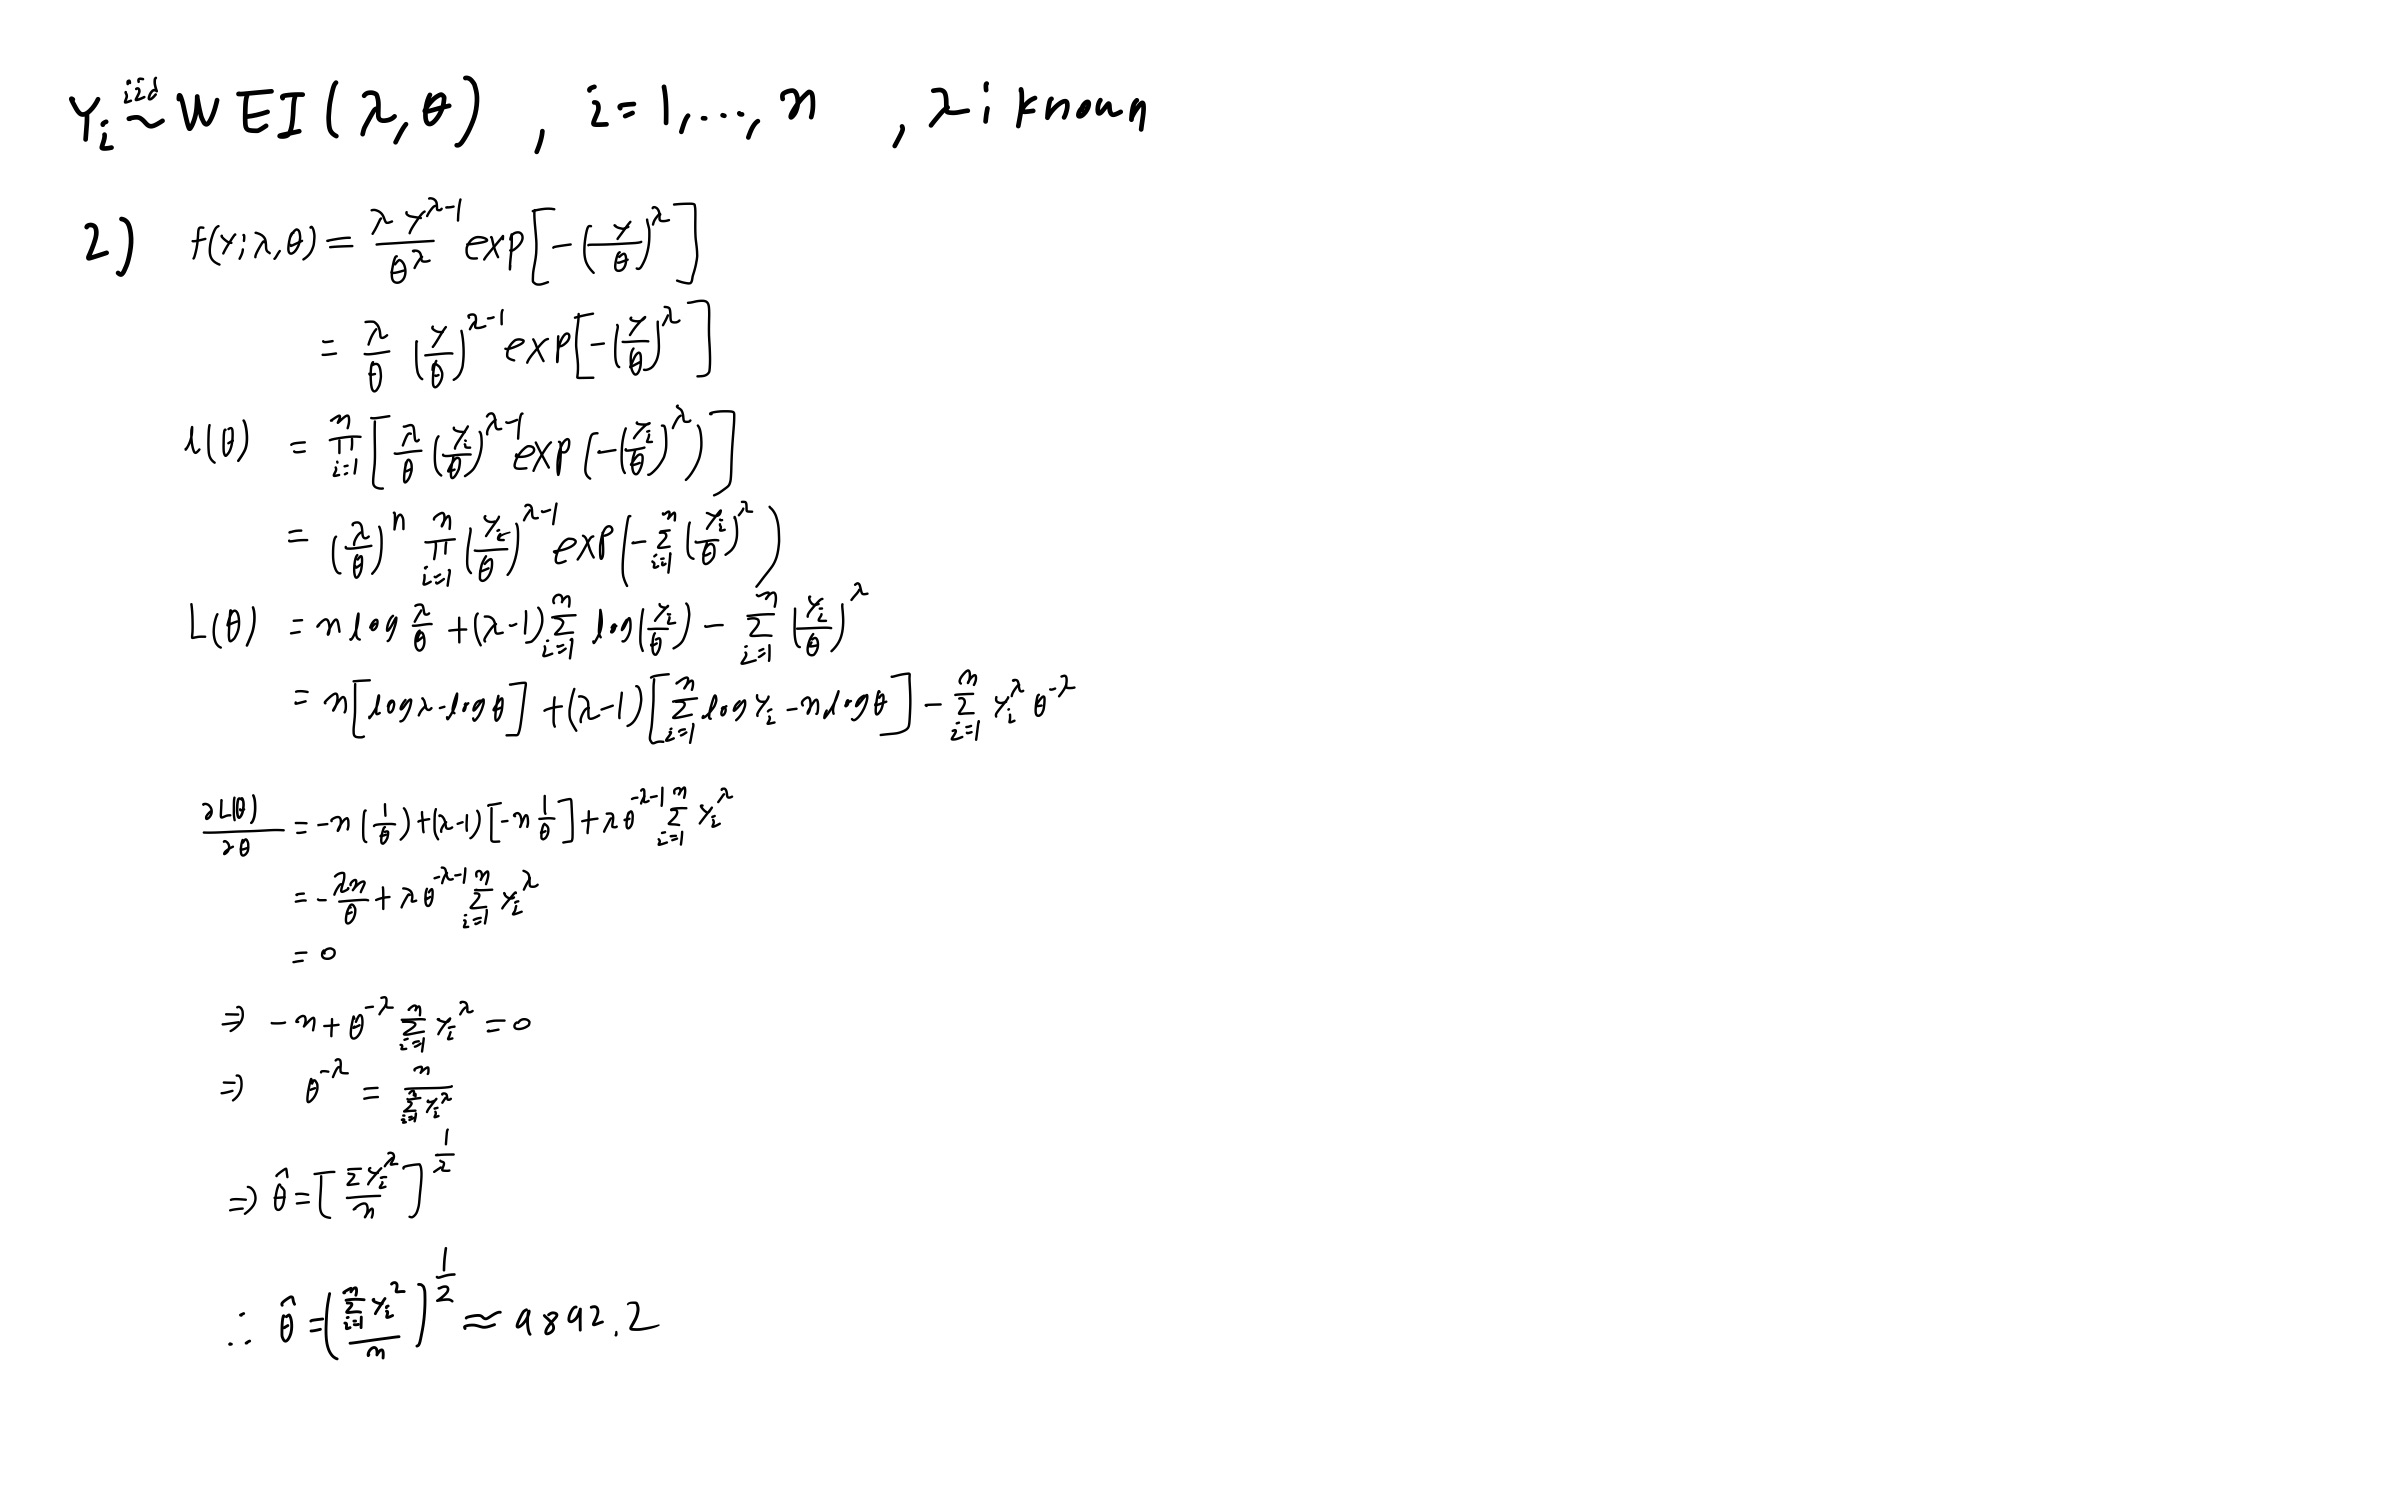
2) Please find the score function and estimate \(\theta\) when \(\lambda=2\).
y <- c(1051, 1337, 1389, 1921, 1942,
       2322, 3629, 4006, 4012, 4063,
       4921, 5445, 5620, 5817, 5905,
       5956, 6068, 6121, 6473, 7501,
       7886, 8108, 8546, 8666, 8831,
       9106, 9711, 9806, 10205, 10396,
       10861, 11026, 11214, 11362, 11604,
       11608, 11745, 11762, 11895, 12044,
       13520, 13670, 14110, 14496, 15395,
       16179, 17092, 17568, 17568)
sqrt(sum(y^2)/length(y))
## [1] 9892.177
Q-1 3)
3) Please derive the fisher information formula for \(\theta\).
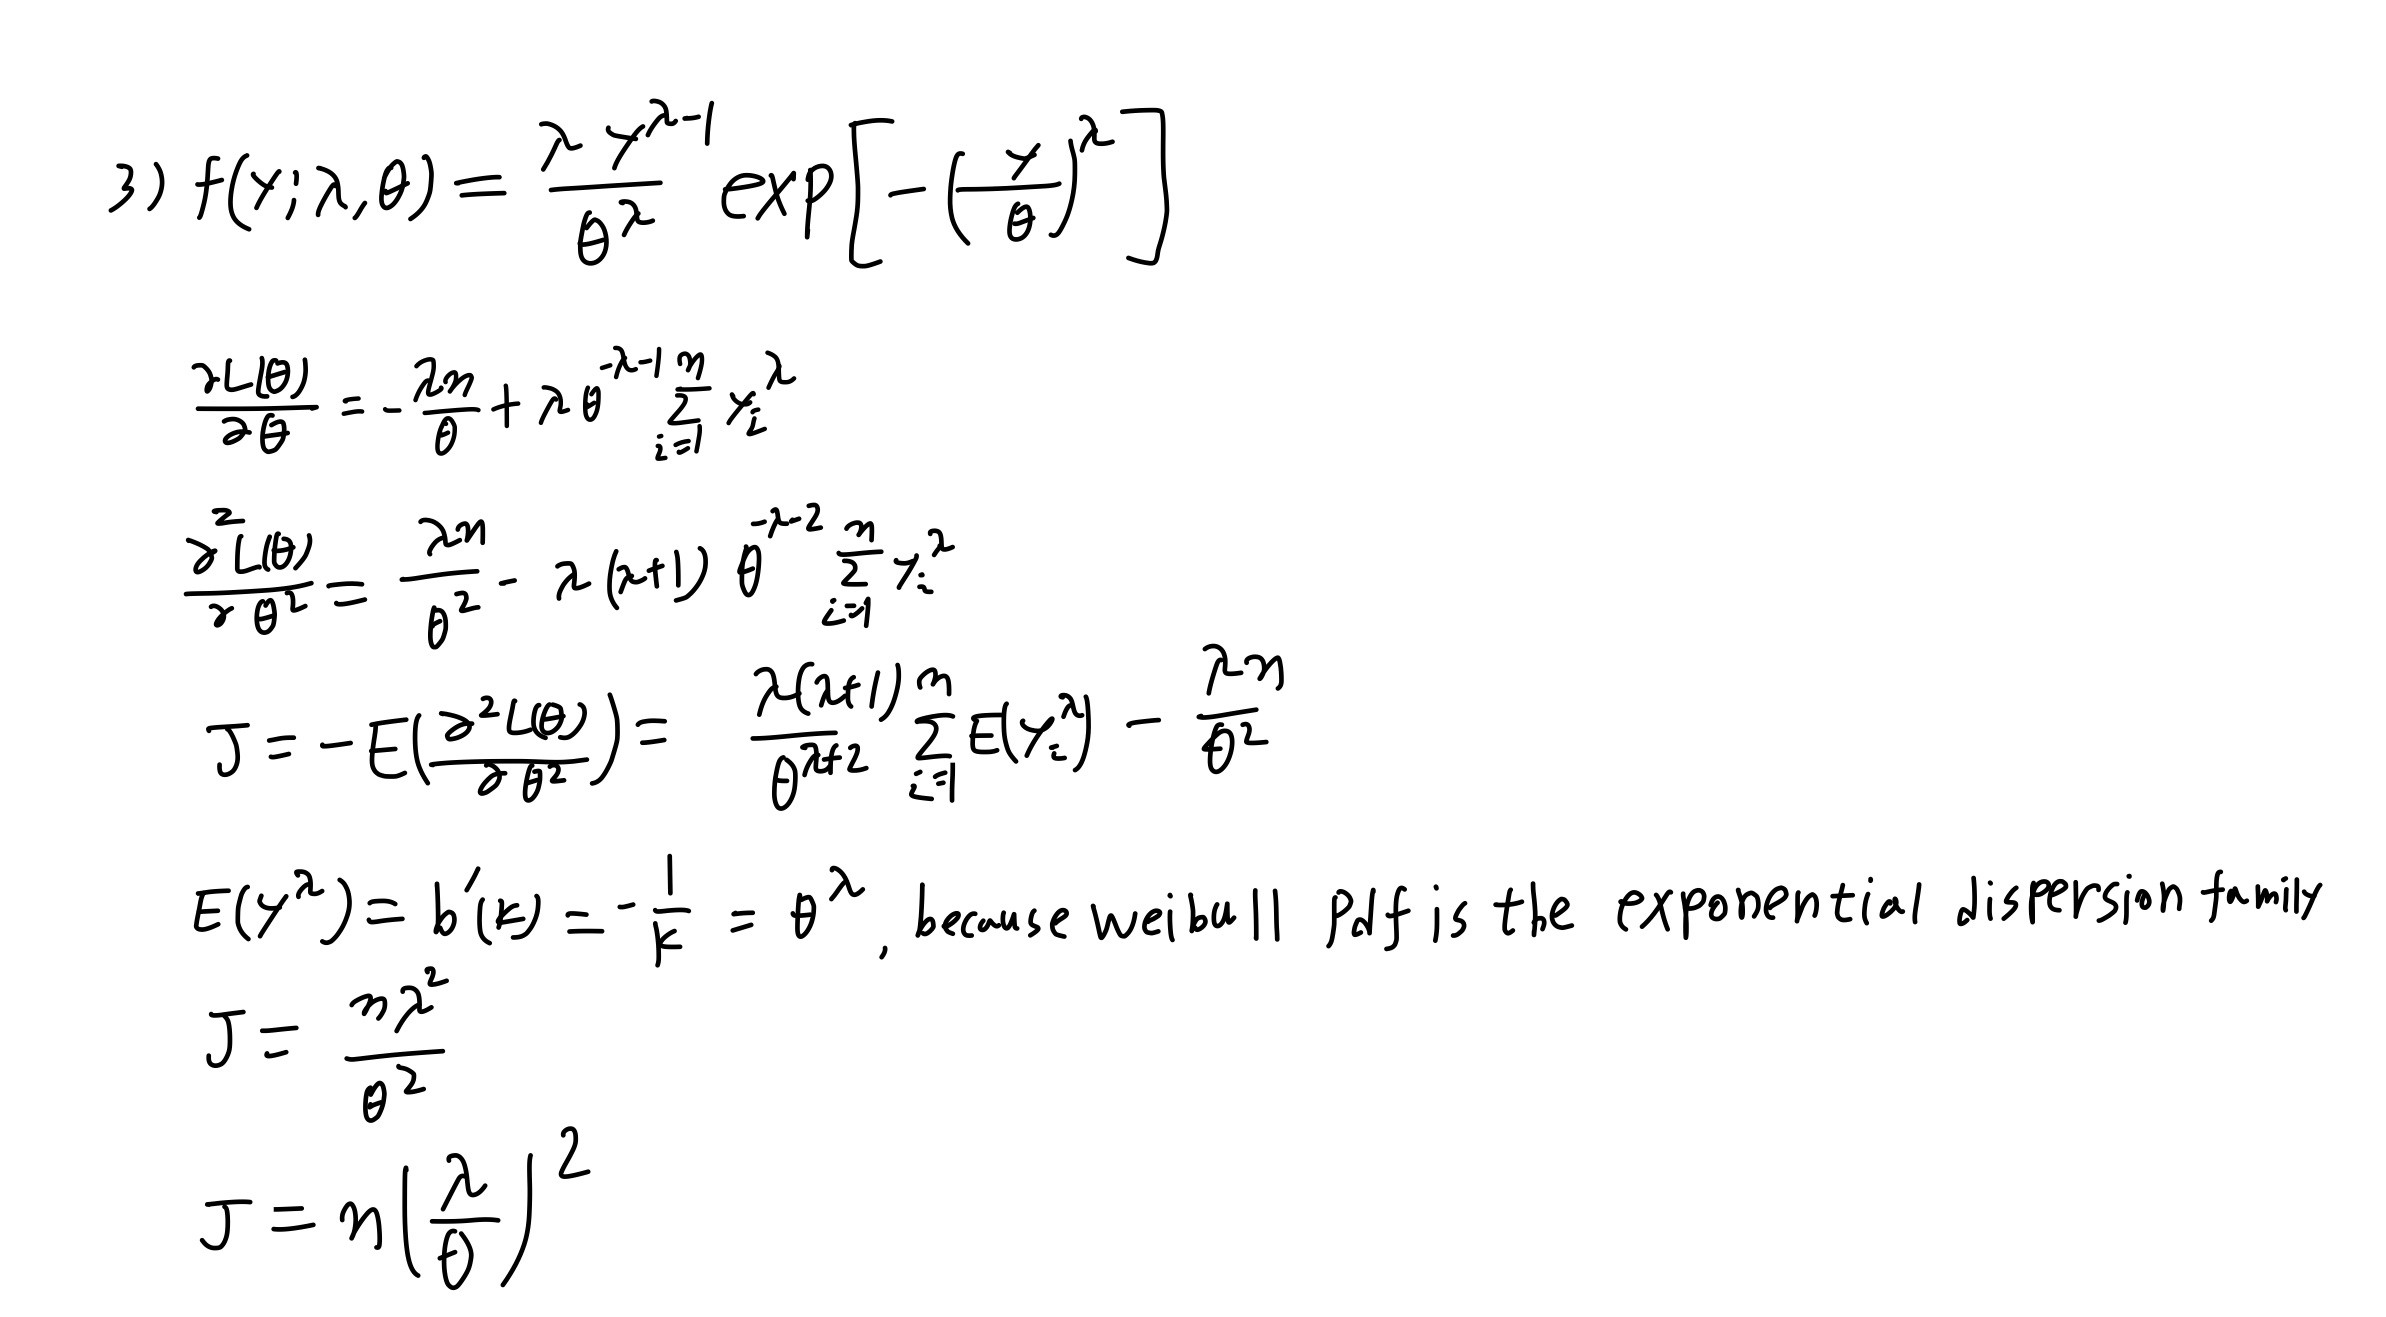
Q-1 4)
4) Use the Newton-Raphson formula to find \(\theta\).
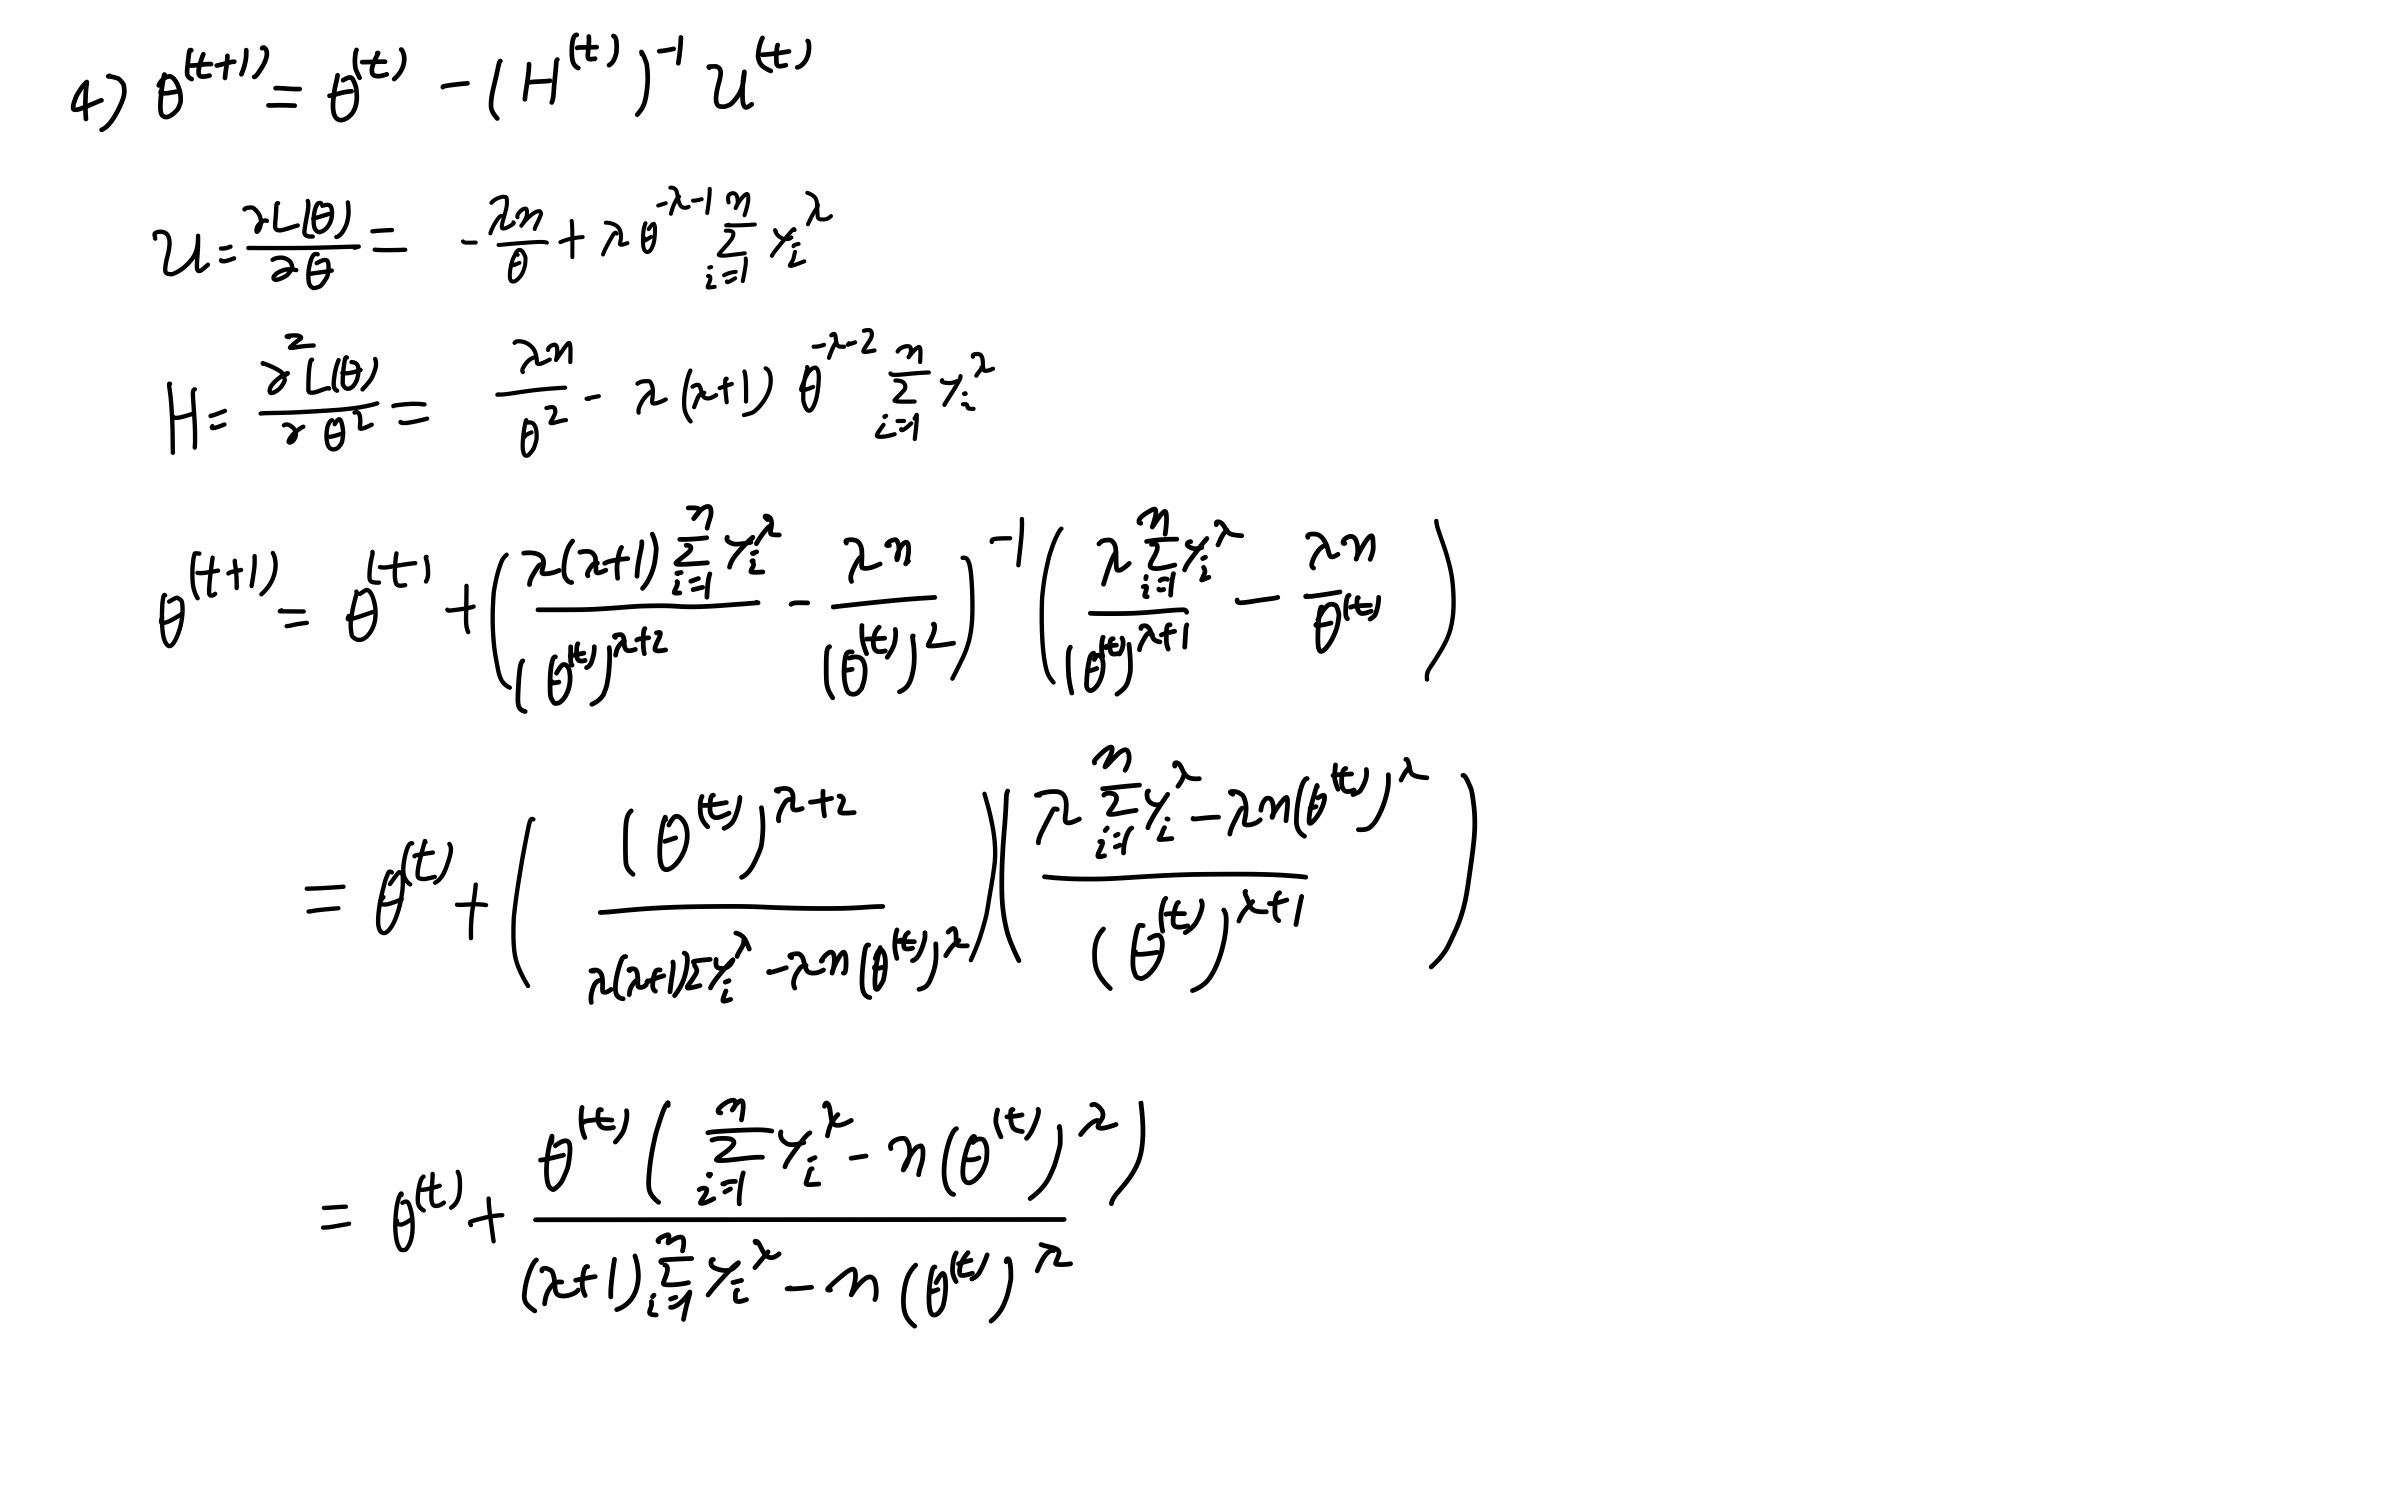
Q-1 5)
5) Suppose that \(\theta^{𝓀}\) the \(𝓀^{th}\) iterated value based on the NewtonRapson formmula. Obtain the fifth iterated value \(\theta^{5}\) given \(\lambda=2\).

a0 <- mean(y)

for( i in 0:5){
a0 <- a0+(a0*(sum(y^2)-length(y)*a0^2))/(3*sum(y^2)-length(y)*a0^2)
print(i)
print(a0)
}
## [1] 0
## [1] 9633.777
## [1] 1
## [1] 9875.898
## [1] 2
## [1] 9892.11
## [1] 3
## [1] 9892.177
## [1] 4
## [1] 9892.177
## [1] 5
## [1] 9892.177
초기값을 \(E(Y_i)\)로 설정하여 돌려본 결과 3번만의 MLE로 잘 추정하는 결과가 나왔다.
Q-1 6)
Please construct 95% confidence interval vasd on Wald test for testing \(H_0 : \theta = 0 \ vs \ H_1 : \theta \neq 0\).
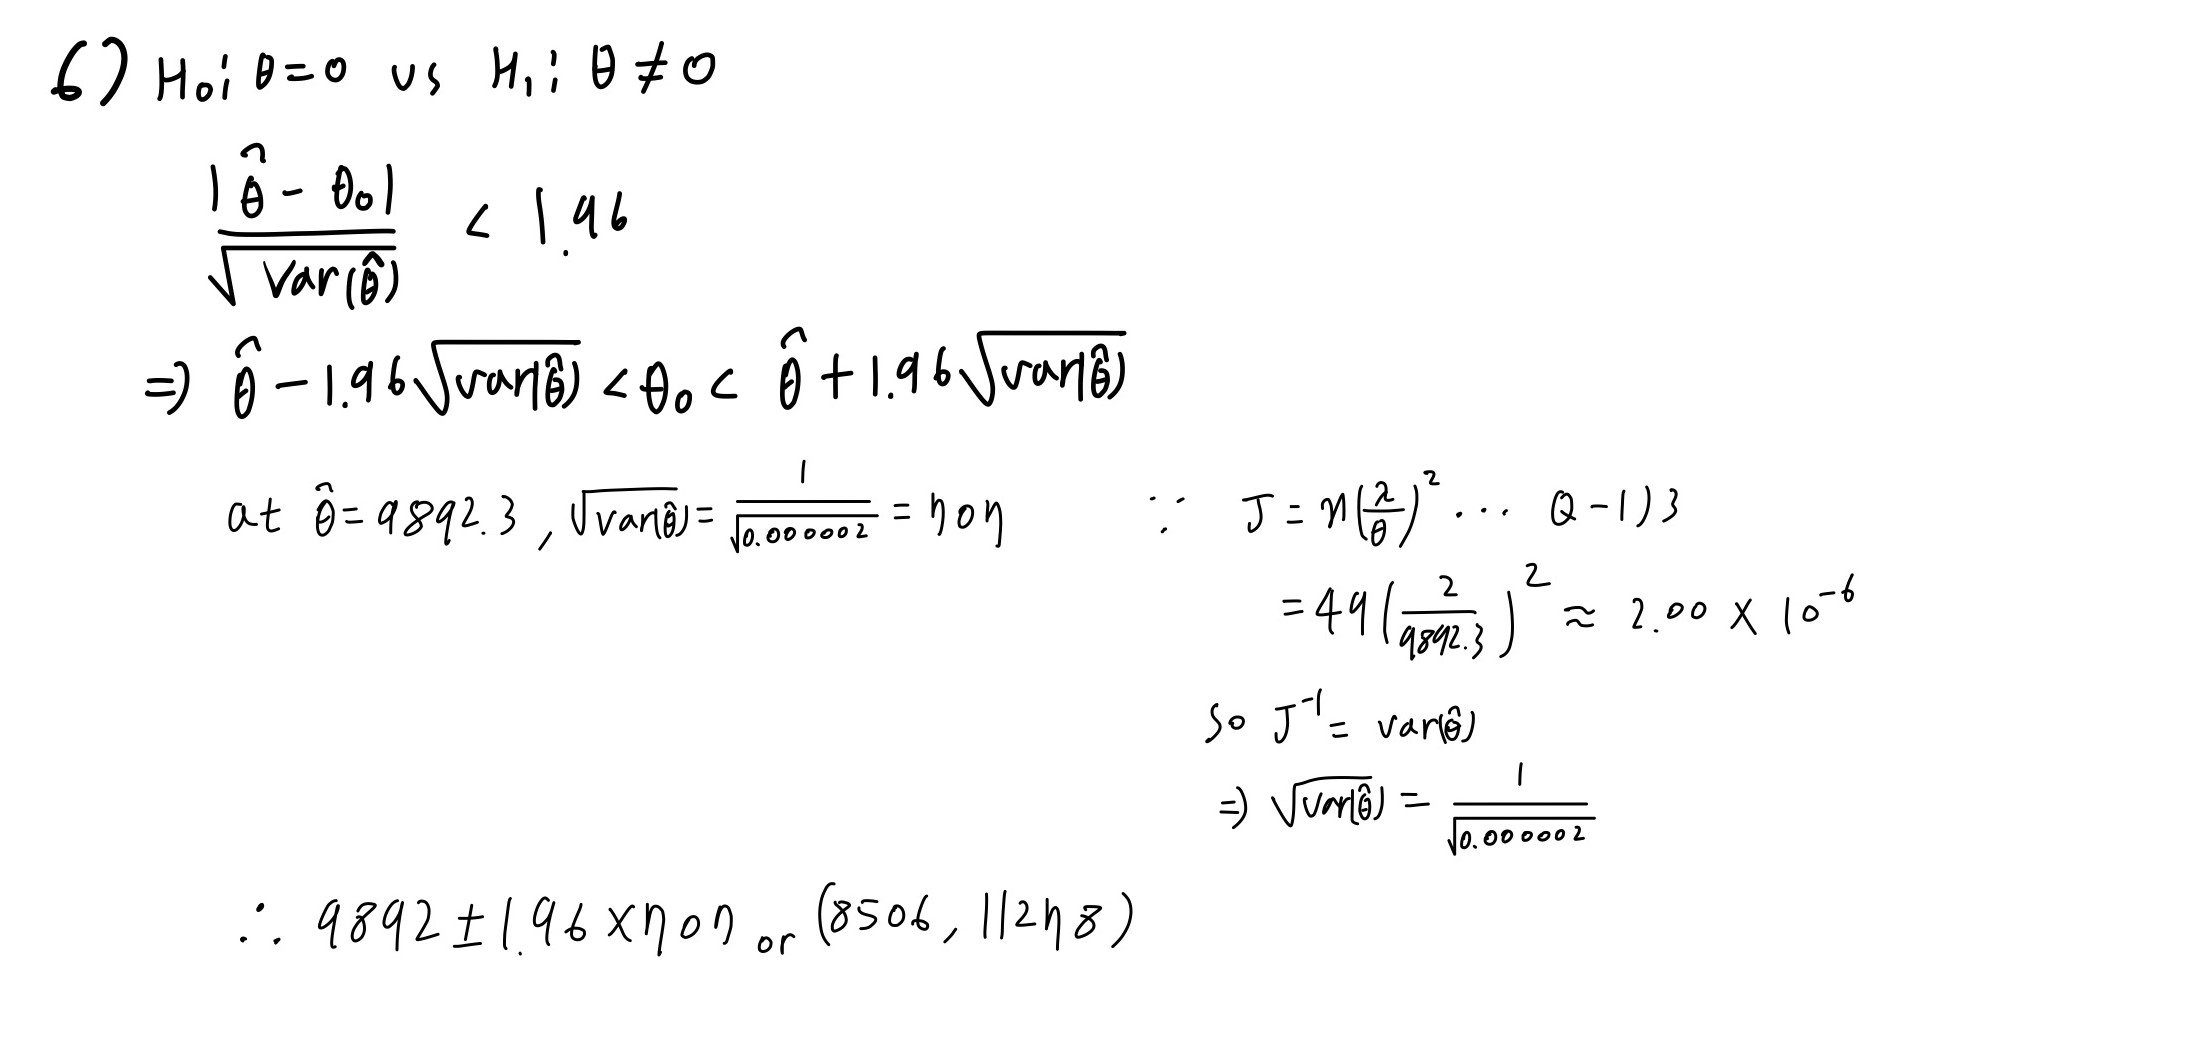
Q-2
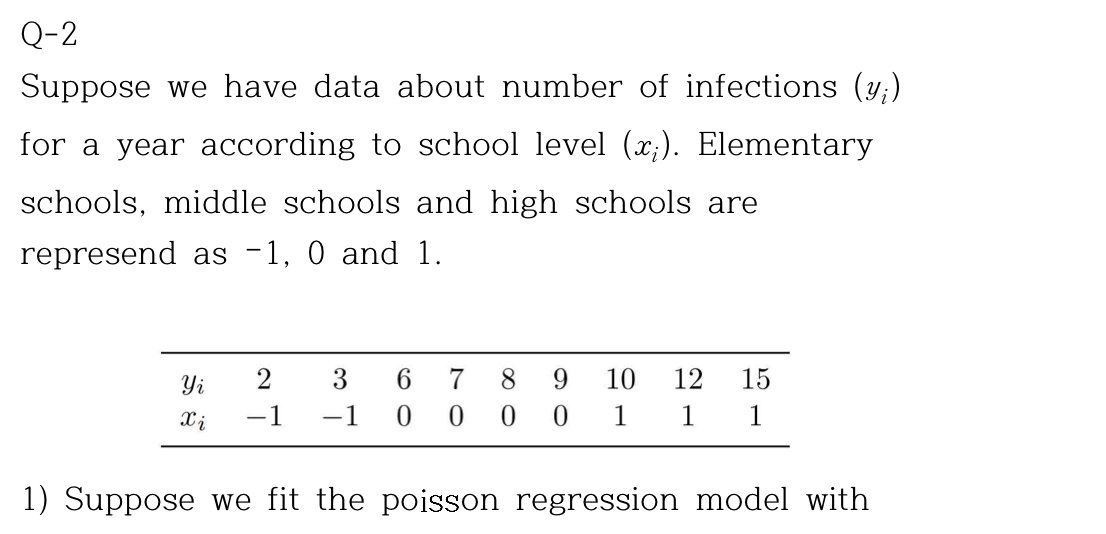

y <- c(2,3,6,7,8,9,10,12,15)
x <- c(-1,-1,0,0,0,0,1,1,1)
a <- list(y,x)
data <- data.frame(y,x)
data%>%
  kbl(caption = "Q-2 dataset") %>%
  kable_minimal() %>%
  kable_styling(bootstrap_options = c("striped", "hover", "condensed", "responsive"))
| y | x |
|---|---|
| 2 | -1 |
| 3 | -1 |
| 6 | 0 |
| 7 | 0 |
| 8 | 0 |
| 9 | 0 |
| 10 | 1 |
| 12 | 1 |
| 15 | 1 |
Q-2 1)
poi_reg <- glm(y~x,family=poisson(link=identity),data=data)
summary <- summary(glm(y~x,family=poisson(link=identity),data=data))
summary$coefficients%>%
  kbl(caption = "MLE") %>%
  kable_minimal() %>%
  kable_styling(bootstrap_options = c("striped", "hover", "condensed", "responsive"))
| Estimate | Std. Error | z value | Pr(\>\|z\|) | |
|---|---|---|---|---|
| (Intercept) | 7.451633 | 0.8841222 | 8.428284 | 0.0e+00 |
| x | 4.935301 | 1.0891667 | 4.531263 | 5.9e-06 |
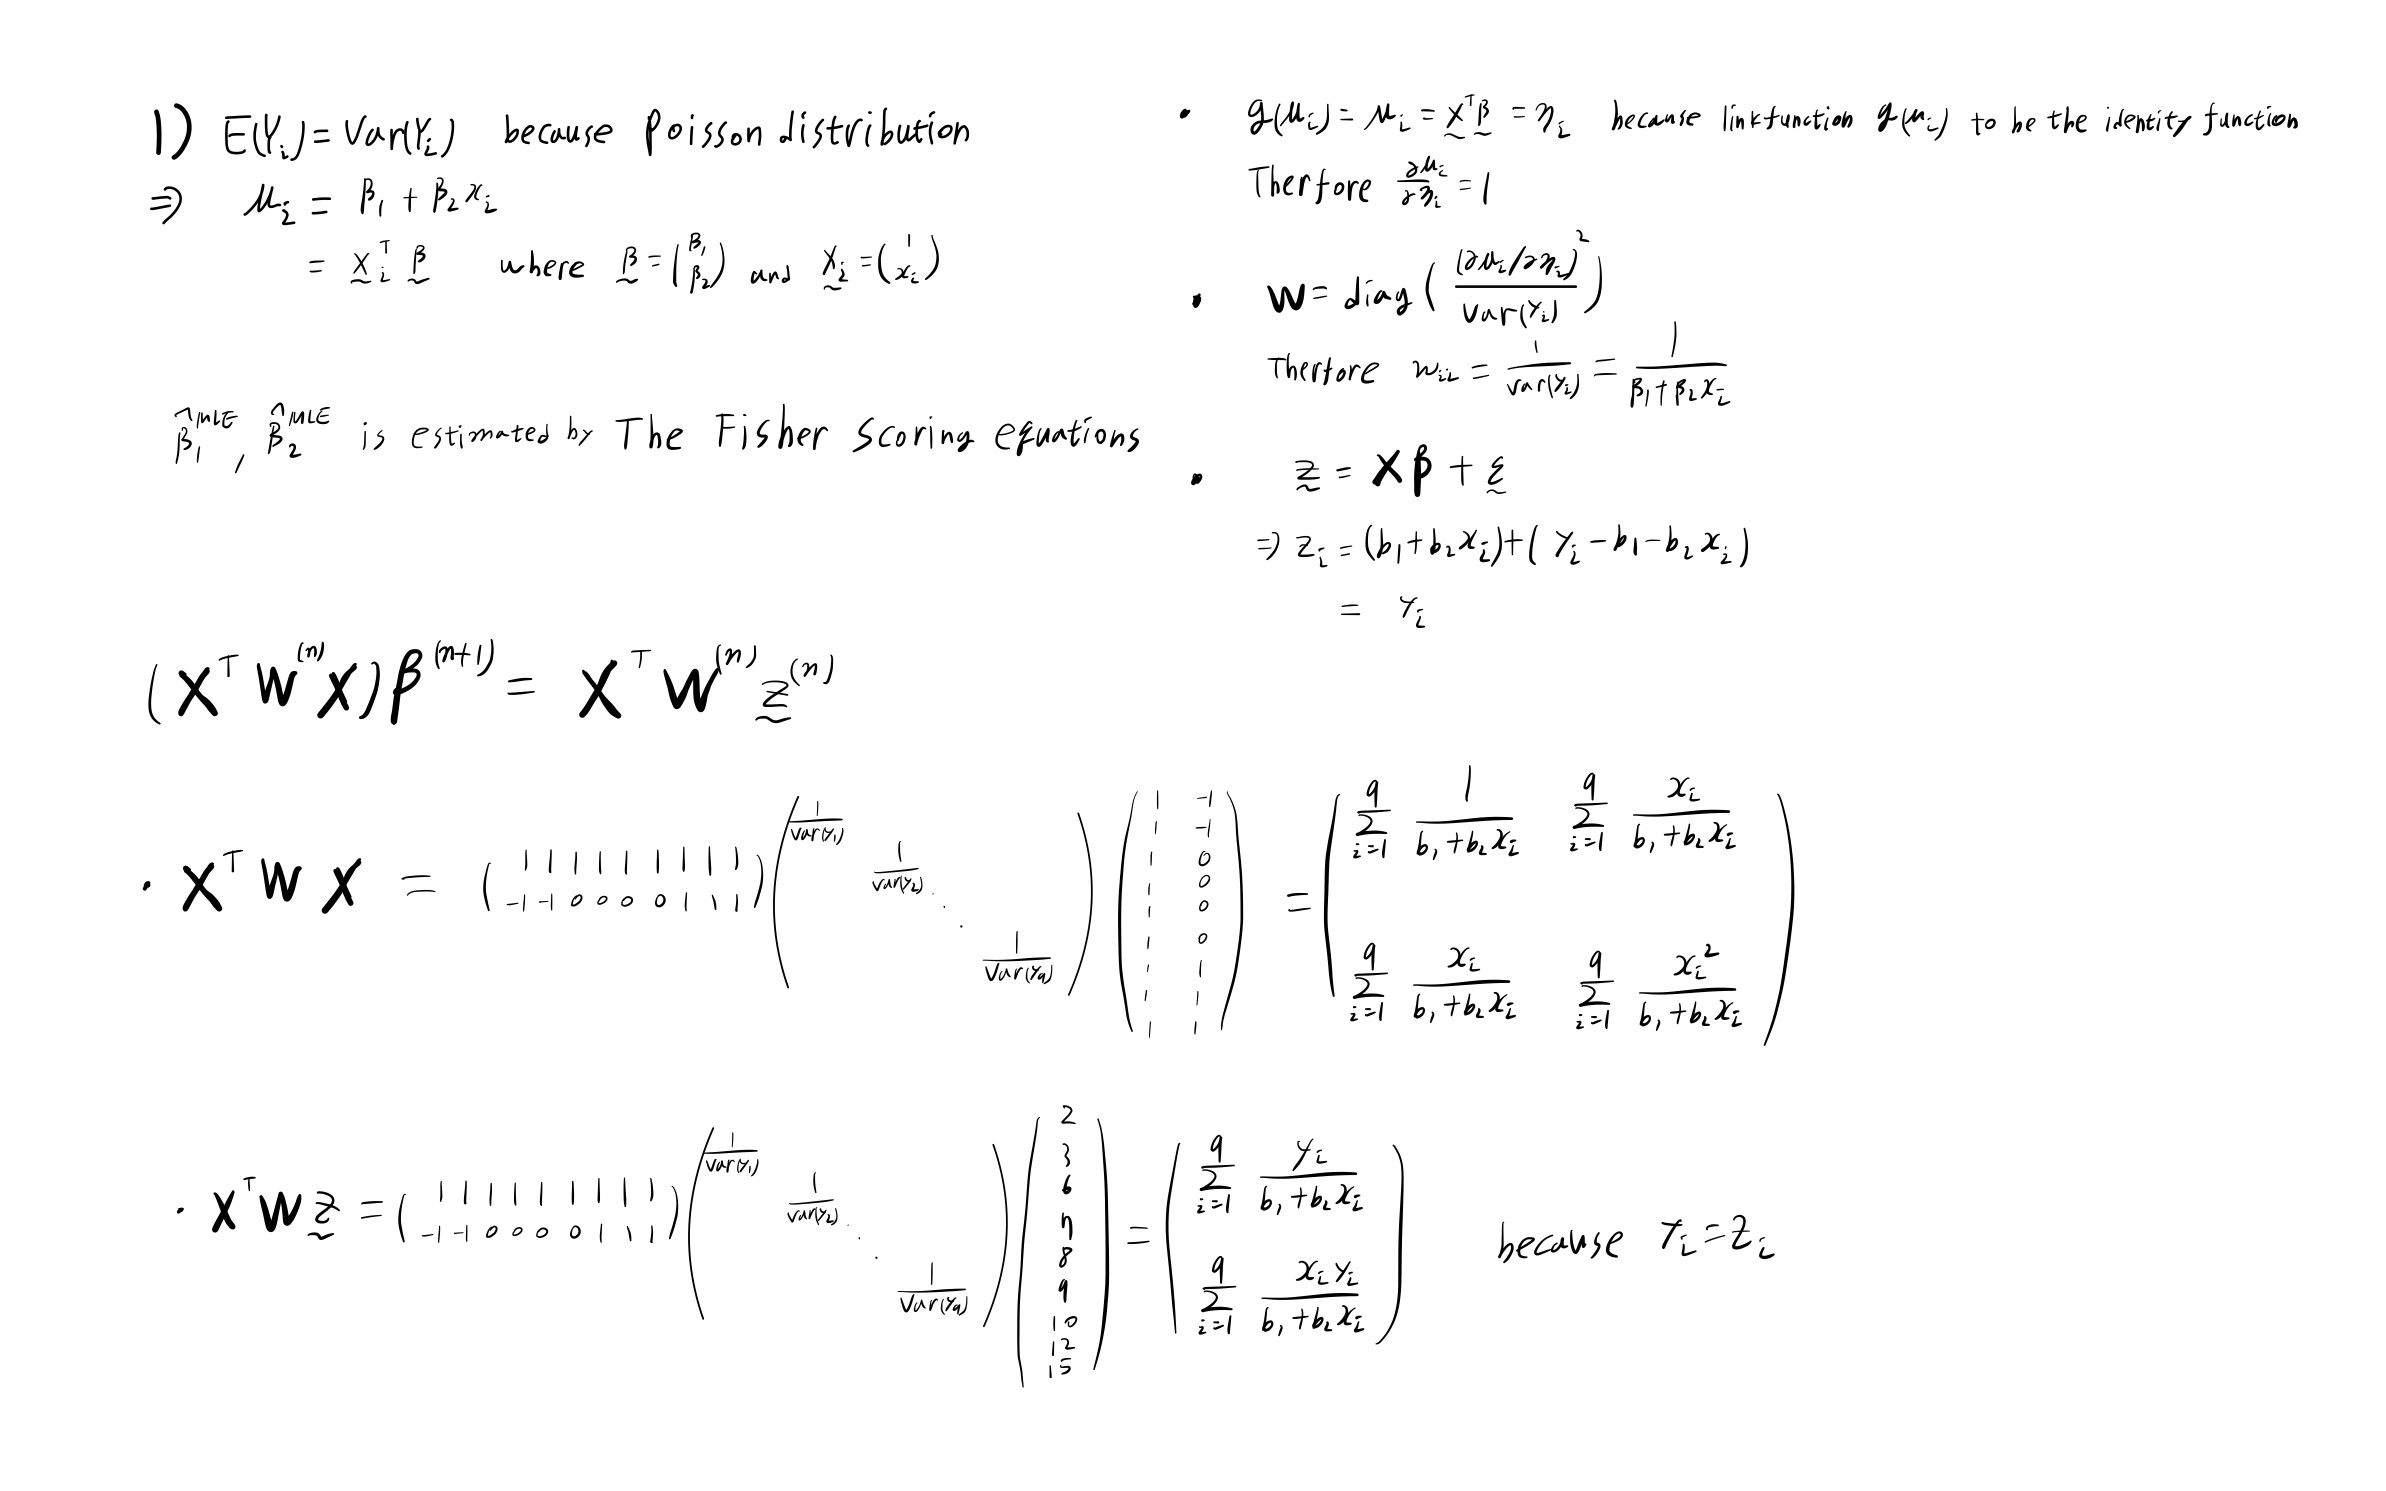
a11 <- sum(1/(2+1*x))
a12 <- sum(x/(2+1*x))
a21 <- sum(x/(2+1*x))
a22 <- sum(x^2/(2+1*x))

a <- matrix(c(a11,a12,a21,a22),2,by=T)

b1 <- sum(y/(2+1*x))
b2 <- sum((x*y)/(2+1*x))
b <- matrix(c(b1,b2))
solve(a)%*%b
##          [,1]
## [1,] 7.452381
## [2,] 4.928571
초기값으로 \(\beta_1\)과 \(\beta_2\)에 어떠한 값을 넣더라도 \(\beta_1 \approx 7\), \(\beta_2 \approx 5\)되므로
초기값으로\(\beta_1^{(1)} \approx 7\), \(\beta_2^{(1)} \approx 5\)
b1 <- 7
b2 <- 5

for( i in 2:5){
J <- matrix(c(sum(1/(b1+b2*x)),sum(x/(b1+b2*x)),sum(x/(b1+b2*x)),sum(x^2/(b1+b2*x))),2,by=T)
z <- matrix(c(sum(y/(b1+b2*x)),sum((x*y)/(b1+b2*x))))
b1b2 <- solve(J)%*%z
b1 <- b1b2[1,1]
b2 <- b1b2[2,1]
print(i)
print(b1b2)
}
## [1] 2
##          [,1]
## [1,] 7.451389
## [2,] 4.937500
## [1] 3
##          [,1]
## [1,] 7.451632
## [2,] 4.935314
## [1] 4
##          [,1]
## [1,] 7.451633
## [2,] 4.935300
## [1] 5
##          [,1]
## [1,] 7.451633
## [2,] 4.935300
\(\hat\beta_1= 7.45163\), \(\hat \beta_2 = 4.93530\)
Q-2 2)
vcov(summary)%>%
  kbl(caption = "Variance-covariance matrix") %>%
  kable_material(c("striped", "hover"))
| (Intercept) | x | |
|---|---|---|
| (Intercept) | 0.7816721 | 0.4165711 |
| x | 0.4165711 | 1.1862840 |
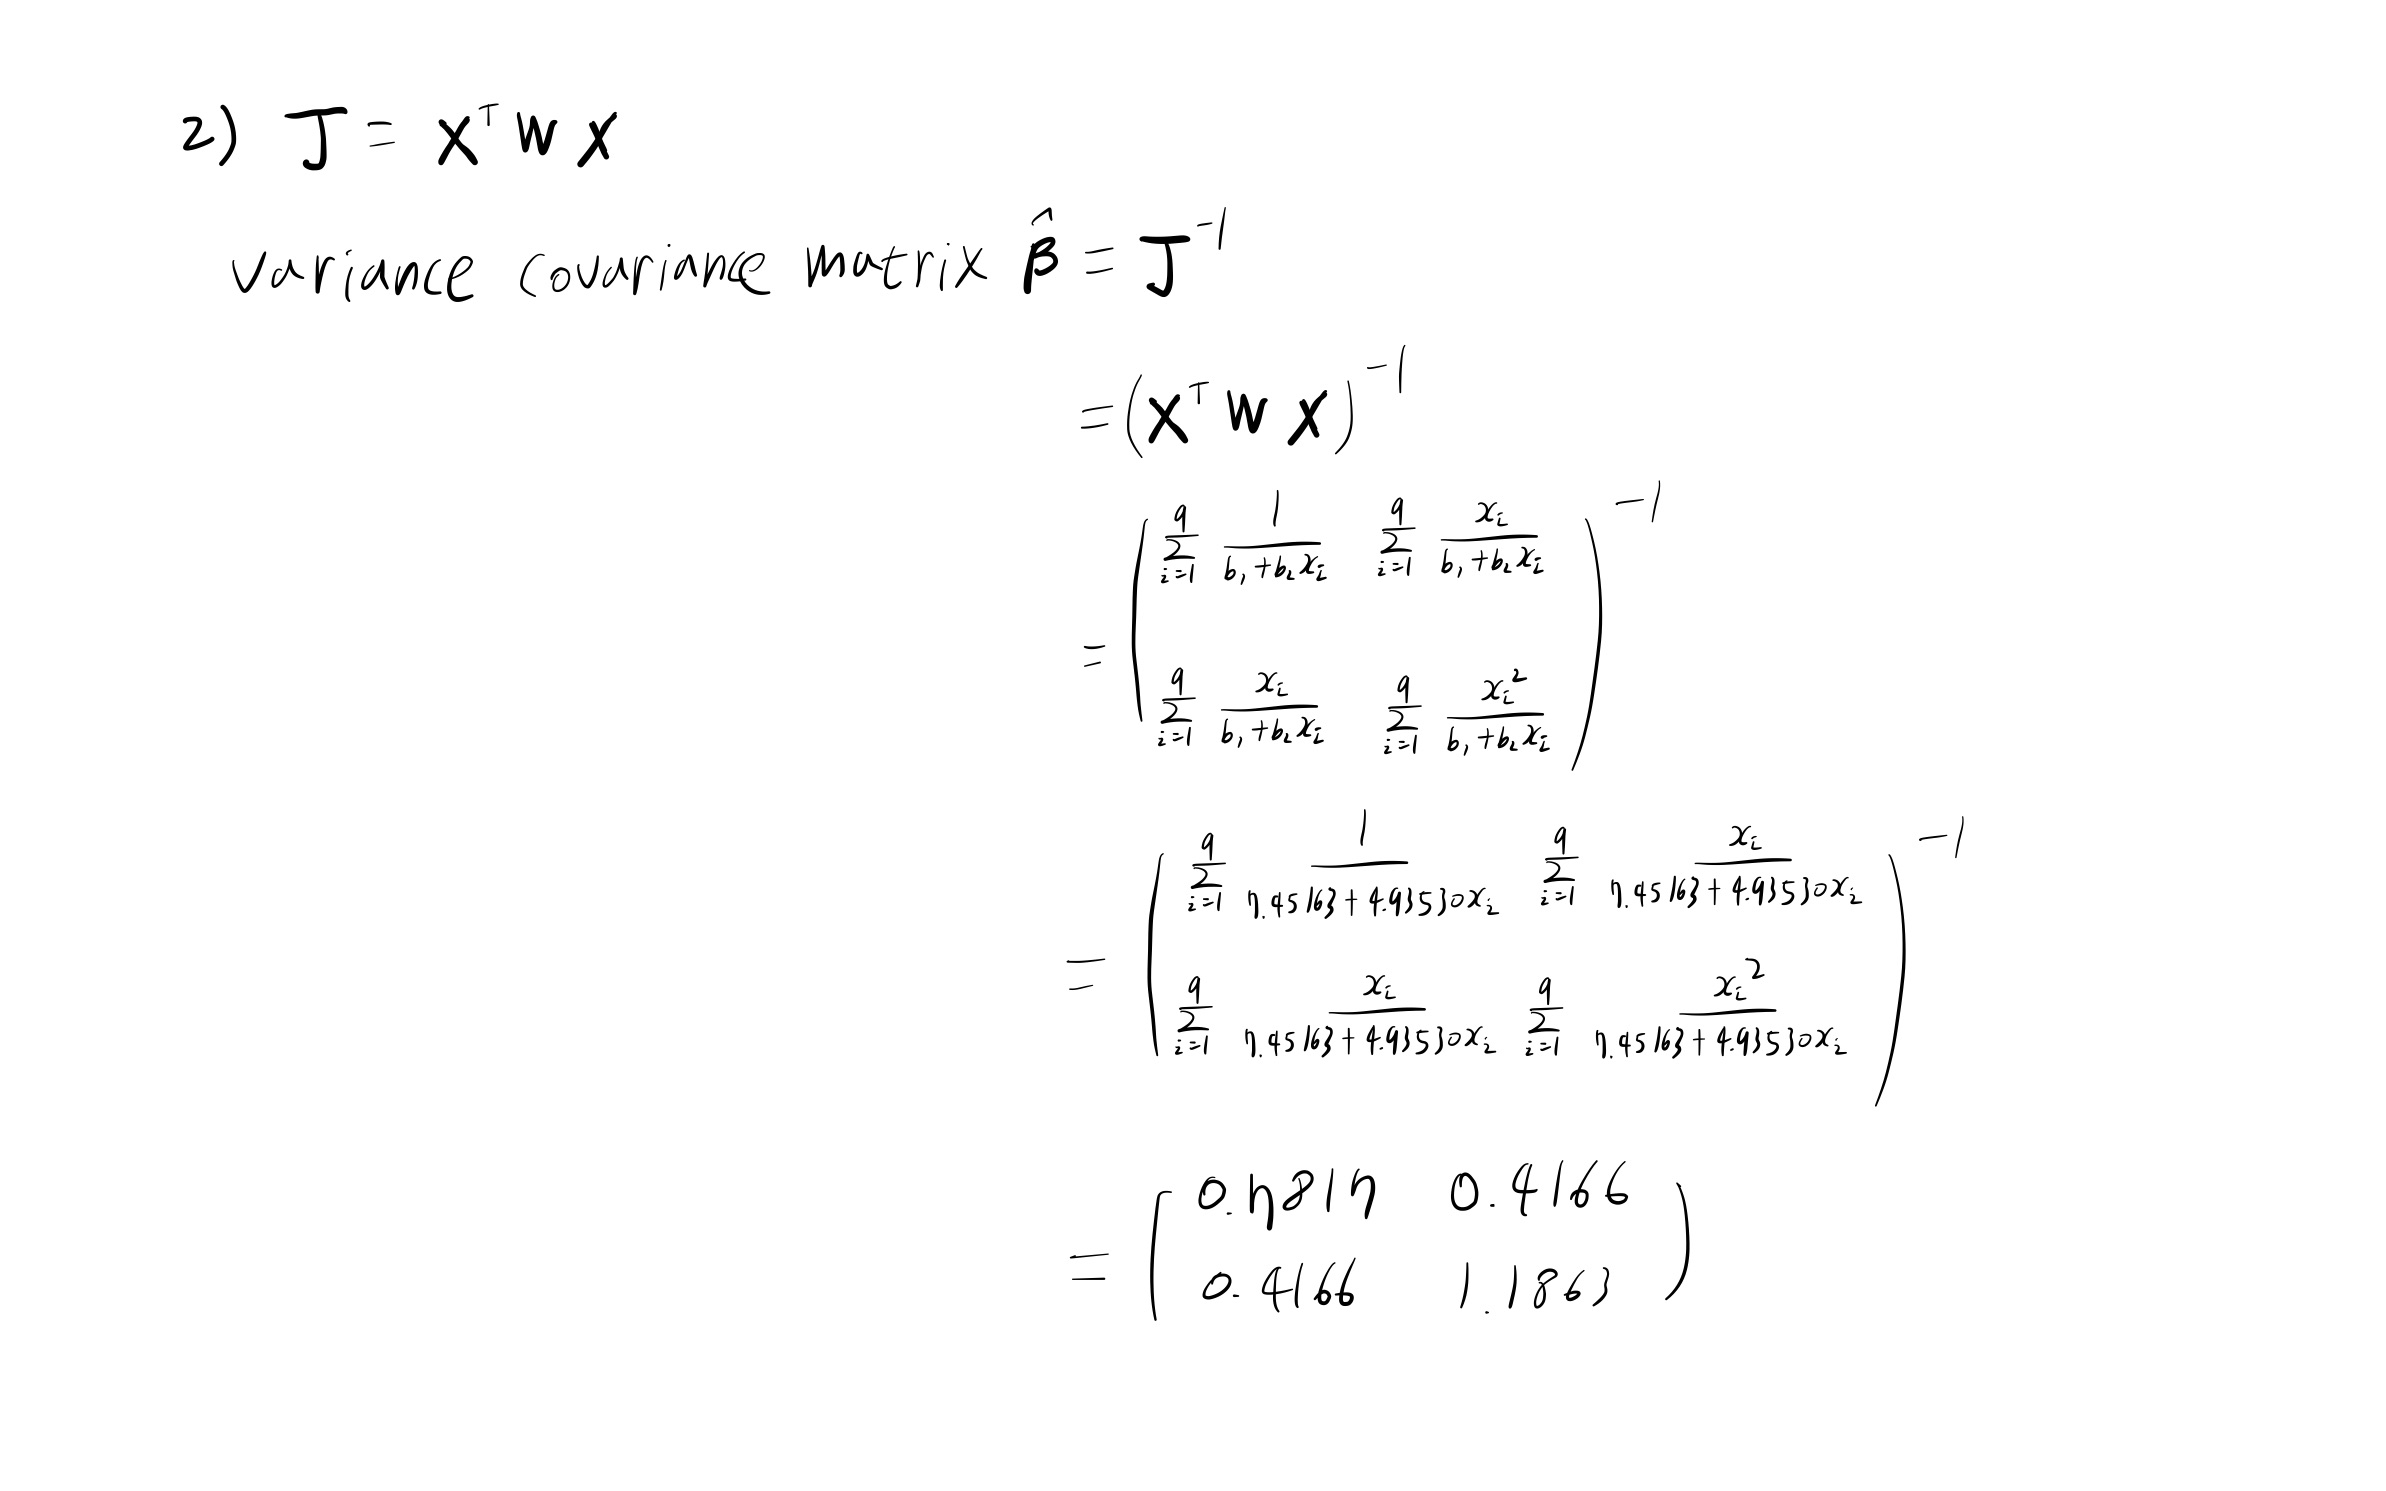
solve(J)
##           [,1]      [,2]
## [1,] 0.7816754 0.4165551
## [2,] 0.4165551 1.1863043
Q-2 3)
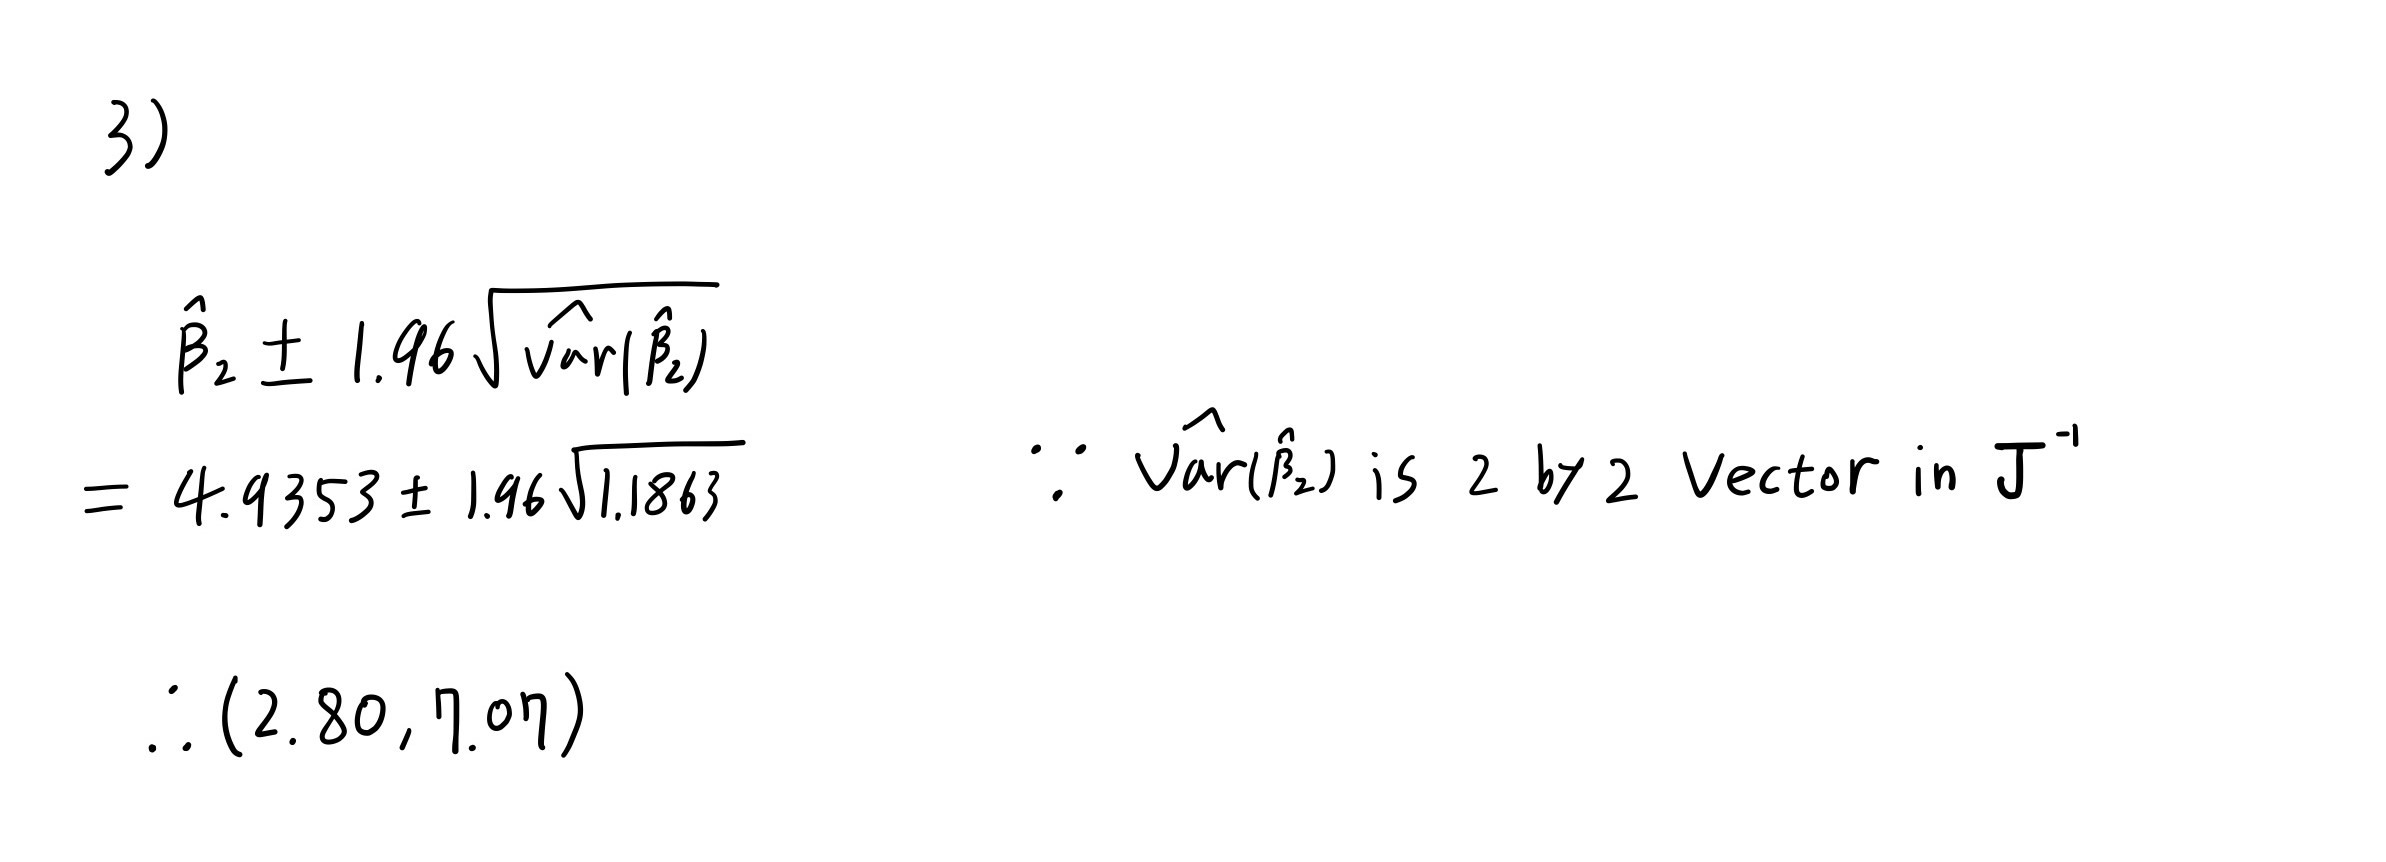
confint(poi_reg)[2,1:2]%>%
  t()%>%
  kbl(caption = "95% CI based on Wald test") %>%
  kable_minimal() %>%
  kable_styling(bootstrap_options = c("striped", "hover", "condensed", "responsive"))
| 2.5 % | 97.5 % |
|---|---|
| 2.697133 | 7.050466 |
Q-3

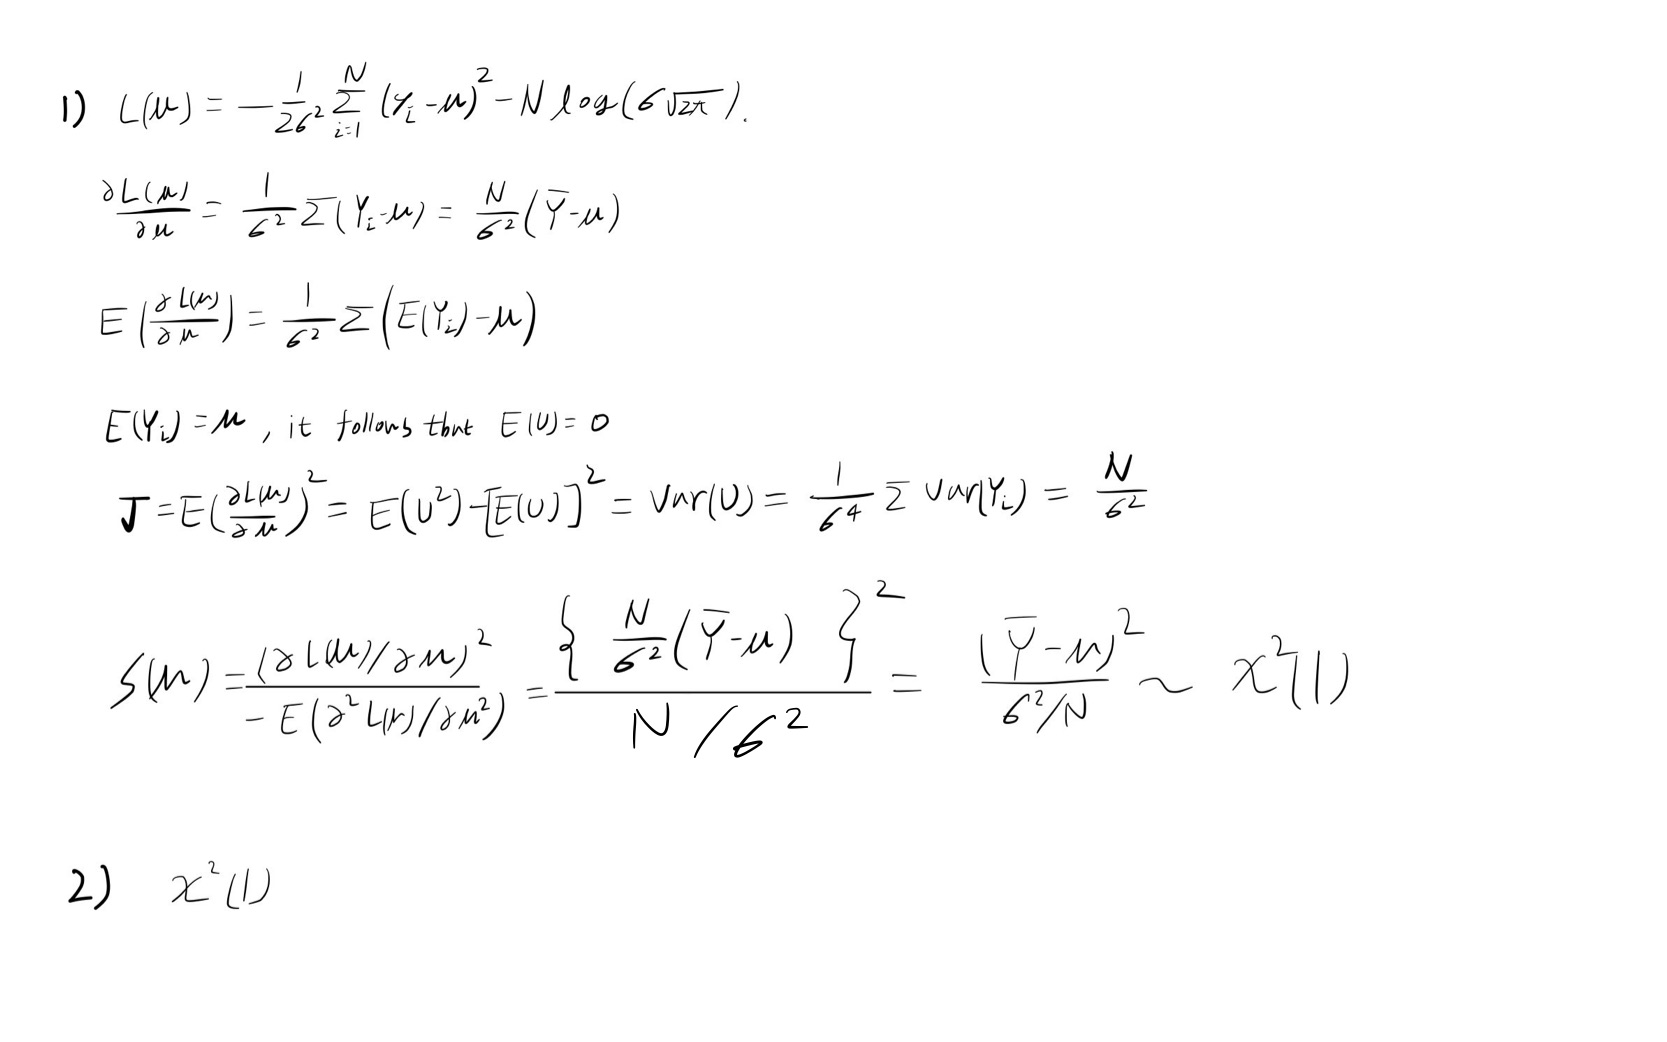
Q-3 1,2)
Q-4

Crabs dataset
Crabs <- read.table("https://users.stat.ufl.edu/~aa/glm/data/Crabs.dat", header = T)
head(Crabs) %>%
  kbl(caption = "Crabs dataset") %>%
  kable_material(c("striped", "hover"))
| crab | y | weight | width | color | spine |
|---|---|---|---|---|---|
| 1 | 8 | 3.05 | 28.3 | 2 | 3 |
| 2 | 0 | 1.55 | 22.5 | 3 | 3 |
| 3 | 9 | 2.30 | 26.0 | 1 | 1 |
| 4 | 0 | 2.10 | 24.8 | 3 | 3 |
| 5 | 4 | 2.60 | 26.0 | 3 | 3 |
| 6 | 0 | 2.10 | 23.8 | 2 | 3 |
satellites가 y값이며 빈도(count) 데이터이기 때문에 Poisson loglinear model을 적합시켰다.
summ <- summary(glm(y ~ width, data=Crabs, family=poisson(link=log)))
summ_m <- data.frame(summ$coefficients)%>%
  rename("coefficient"="Estimate","Std.Error"="Std..Error","z value"="z.value","p value"="Pr...z..") %>%
  kable(caption = "Summary of glm",booktabs = TRUE, valign = 't')%>%
  kable_styling(bootstrap_options = c("striped", "hover", "condensed", "responsive"))
summ_m
| coefficient | Std.Error | z value | p value | |
|---|---|---|---|---|
| (Intercept) | -3.3047572 | 0.5422416 | -6.094622 | 1.1e-09 |
| width | 0.1640451 | 0.0199653 | 8.216491 | < 2e-16 |
width를 predictor로 두었을 때 유의확률이 매우 significant한 것으로 보여진다.
summ2 <- summary(glm(y ~ weight + width, data=Crabs, family=poisson(link=log)))
summ2_m <- data.frame(summ2$coefficients)%>%
  rename("coefficient"="Estimate","Std.Error"="Std..Error","z value"="z.value","p value"="Pr...z..") %>%
  kable(caption = "Summary of glm add weight as a predictor",booktabs = TRUE, valign = 't')%>%
  kable_styling(bootstrap_options = c("striped", "hover", "condensed", "responsive"))
summ2_m
| coefficient | Std.Error | z value | p value | |
|---|---|---|---|---|
| (Intercept) | -1.2952111 | 0.8988960 | -1.4408910 | 0.1496155 |
| weight | 0.4469701 | 0.1586207 | 2.8178547 | 0.0048346 |
| width | 0.0460765 | 0.0467497 | 0.9855991 | 0.3243299 |
predictor로 weight가 추가되었을 때 유의확률이 non significant하게 결과가 나왔으며, width의 SE가 두배정도 커지고 Estimate값은 줄어드는 결과를 일으킨다.
왜 이러한 결과를 일으키는지 두 변수사이의 연관성을 통해 알아보고자 한다.
cor(Crabs$weight, Crabs$width) %>% data.frame() %>%
  rename("Correlation coefficient"=".")%>%
  kable(caption = "Correlation between weight and width",booktabs = TRUE, valign = 't')%>%
  kable_styling(bootstrap_options = c("striped", "hover", "condensed", "responsive"))
| Correlation coefficient |
|---|
| 0.8868715 |
두 변수 사이의 연관성이 0.8이상의 값이 출력된 것으로 보아 width와 weight 사이의 Correlation이 높음으로인해 위와 같은 문제가 발생한 것으로 보인다.
빈도자료에 대해서 poisson regression은 굉장히 strict한 모형이다.
조금 더 확장된 모형으로 negative binomial distribution를 가정한 모형인 two-parameter distribution를 적용하는 것이 적절해 보인다.
cor <- cor(Crabs$weight, Crabs$width)
vif <- 1/(1-cor^2)
vif
## [1] 4.68474
non significant해진 이유는 Correlation이 높았으며
\[VIF= \frac{1}{1-(0.887)^2}=4.68474\]
VIF=4.68474의 결과가 출력된다.
Houses selling price dataset
데이터셋 설명
Houses <- read.table("https://users.stat.ufl.edu/~aa/glm/data/Houses.dat", header = T)
head(Houses)%>%
  kbl(caption = "Houses dataset") %>%
  kable_styling(bootstrap_options = c("striped", "hover", "condensed", "responsive"))
Houses dataset으로 집의 가격을 예측하는 모델을 만들어 보겠다.
| case | taxes | beds | baths | new | price | size |
|---|---|---|---|---|---|---|
| 1 | 3104 | 4 | 2 | 0 | 279.9 | 2048 |
| 2 | 1173 | 2 | 1 | 0 | 146.5 | 912 |
| 3 | 3076 | 4 | 2 | 0 | 237.7 | 1654 |
| 4 | 1608 | 3 | 2 | 0 | 200.0 | 2068 |
| 5 | 1454 | 3 | 3 | 0 | 159.9 | 1477 |
| 6 | 2997 | 3 | 2 | 1 | 499.9 | 3153 |
taxes : 연간 세금 고지서 (in dollars)
beds : 침실 수 (2,3,4,5)
baths : 욕실 수 (1,2,3,4)
new : 새 집 여부 (1= yes,0= no)
price (response variable) : 판매 가격 (in thousands of dollars)
size : 집의 크기 (in square feet)
cor <- cor(cbind(Houses$price,Houses$size,Houses$taxes,Houses$beds,Houses$baths)) # correlation matrix
cor %>%
  kbl(caption = "Correlation matrix of House selling price dataset") %>%
  kable_styling(bootstrap_options = c("striped", "hover", "condensed", "responsive"))
| price | size | taxes | beds | baths |
|---|---|---|---|---|
| 1.0000000 | 0.8337848 | 0.8419802 | 0.3939570 | 0.5582533 |
| 0.8337848 | 1.0000000 | 0.8187958 | 0.5447831 | 0.6582247 |
| 0.8419802 | 0.8187958 | 1.0000000 | 0.4739287 | 0.5948543 |
| 0.3939570 | 0.5447831 | 0.4739287 | 1.0000000 | 0.4922224 |
| 0.5582533 | 0.6582247 | 0.5948543 | 0.4922224 | 1.0000000 |
price와 taxes, size 간에 강한 양의 상관관계가 있음으로 보여진다.
Scatterplot matrix로 확인하여 보자.
pairs(cbind(Houses$price,Houses$size,Houses$taxes)) # scatterplot matrix for pairs of var’s

- Backward Elimination with House Selling Price Data
모델을 선택하기 위해 backward elimination 을 사용하여 변수선택을 하도록 한다.
교호작용도 고려해야 하기에 second-order interaction과 third-order interaction을 추가한 모형들을 각각 비교해보도록 한다.
먼저 main effect만 존재하는 모형과 2차 교호작용을 추가한 모형을 비교해보도록 한다.
fit1 <- lm(price ~ size + new + baths + beds, data=Houses)
fit2 <- lm(price ~ (size + new + baths + beds)^2, data= Houses)
fit3 <- lm(price ~ (size + new + baths + beds)^3, data=Houses)
anova(fit1, fit2) %>% kable(caption = "Result of F test",booktabs = TRUE, valign = 't')%>%
  kable_styling(bootstrap_options = c("striped", "hover", "condensed", "responsive"))
| Res.Df | RSS | Df | Sum of Sq | F | Pr(>F) |
|---|---|---|---|---|---|
| 95 | 279624.1 | NA | NA | NA | NA |
| 89 | 217916.4 | 6 | 61707.71 | 4.200378 | 0.0009128 |
main effect만 존재하는 모형과 2차 교호작용을 추가한 모형을 비교해본 결과 p-value가 0.05보다 작아 두 모형에 차이가 존재함을 알 수 있다.
3차 교호작용이 필요한지 알아보기 위해 2차 교호작용이 포함된 모형과 3차 교호작용이 포함된 모델을 비교해보도록 한다.
anova(fit2, fit3)%>% kable(caption = "Result of F test",booktabs = TRUE, valign = 't')%>%
  kable_styling(bootstrap_options = c("striped", "hover", "condensed", "responsive"))
| Res.Df | RSS | Df | Sum of Sq | F | Pr(>F) |
|---|---|---|---|---|---|
| 89 | 217916.4 | NA | NA | NA | NA |
| 85 | 199305.6 | 4 | 18610.81 | 1.984288 | 0.1041848 |
2차 교호작용을 추가한 모형과 3차 교호작용을 추가한 모형을 비교해본 결과 p-value=0.104로 유의수준 0.05보다 크므로 두 모형에 차이가 존재하지 않음을 알 수 있다.
그러므로 3차 교호작용은 고려하지 않겠다.
다음은 main effect 모델과 2차 교호작용을 추가한 모형, 3차 교호작용을 추가한 모형의 걸정계수와 수정된 결정계수를 보인 결과이다.
r <- c(summary(fit1)$r.squared,summary(fit2)$r.squared,summary(fit3)$r.squared)
ar <- c(summary(fit1)$adj.r.squared,summary(fit2)$adj.r.squared,summary(fit3)$adj.r.squared)
name <- c("fit1","fit2","fit3")
data.frame(name,r,ar)%>%
  rename("R square"="r","Adjusted R square"="ar")%>%
  kable(caption = "R square and Adjuted R square",booktabs = TRUE, valign = 't')%>%
  kable_styling(bootstrap_options = c("striped", "hover", "condensed", "responsive"))
| name | R square | Adjusted R square |
|---|---|---|
| fit1 | 0.7245489 | 0.7129509 |
| fit2 | 0.7853357 | 0.7612161 |
| fit3 | 0.8036688 | 0.7713319 |
결정계수값을 확인하여 보면 당연하게도 변수가 더 많이 들어간 모형이 더 큰 값을 갖게 된다.
모델들의 파라미터의 수를 비교하기에 수정된 결정계수에 집중하도록 해보겠다.
다음은 2차 교호작용을 추가한 모형의 변수들의 유의성을 보여준 결과이다.
sum_fit2 <- summary(fit2)
sum_fit2_m <- data.frame(sum_fit2$coefficients)%>%
  rename("coefficient"="Estimate","Std.Error"="Std..Error","t value"="t.value","p value"="Pr...t..") %>%
  kable(caption = "Summary of fit2",booktabs = TRUE, valign = 't')%>%
  kable_styling(bootstrap_options = c("striped", "hover", "condensed", "responsive"))
sum_fit2_m
| coefficient | Std.Error | t value | p value | |
|---|---|---|---|---|
| (Intercept) | 139.0577253 | 66.6233971 | 2.0872206 | 0.0397274 |
| size | -0.0019477 | 0.0561268 | -0.0347020 | 0.9723951 |
| new | 103.3107619 | 106.4540998 | 0.9704724 | 0.3344412 |
| baths | 14.2610985 | 47.0325661 | 0.3032175 | 0.7624317 |
| beds | -59.5421033 | 33.3010781 | -1.7879933 | 0.0771804 |
| size:new | 0.1052939 | 0.0306909 | 3.4307820 | 0.0009145 |
| size:baths | -0.0030832 | 0.0159029 | -0.1938756 | 0.8467151 |
| size:beds | 0.0327667 | 0.0166142 | 1.9722095 | 0.0516904 |
| new:baths | -104.3218174 | 51.8093215 | -2.0135724 | 0.0470750 |
| new:beds | -10.4471405 | 40.1690392 | -0.2600794 | 0.7954032 |
| baths:beds | 0.8135120 | 17.5004355 | 0.0464852 | 0.9630276 |
결과를 보아 baths:beds 교호작용이 유의하지 않음을 확인할 수 있다.
이를 제거하고 모델을 피팅시켜보면 결과는 다음과 같다.
fit4 <- lm(price ~ size + new + beds + baths + size*new + size*baths + size*beds + new*baths + new*beds, data=Houses)
sum_fit4 <- summary(fit4)
sum_fit4_m <- data.frame(sum_fit4$coefficients)%>%
  rename("coefficient"="Estimate","Std.Error"="Std..Error","t value"="t.value","p value"="Pr...t..") %>%
  kable(caption = "Summary of fit4",booktabs = TRUE, valign = 't')%>%
  kable_styling(bootstrap_options = c("striped", "hover", "condensed", "responsive"))
sum_fit4_m;sum_fit4$adj.r.squared%>%
  data.frame()%>%
  rename("Adjusted R square"=".")%>%
  kable(caption = "Adjusted R square",booktabs = TRUE, valign = 't')%>%
  kable_styling(bootstrap_options = c("striped", "hover", "condensed", "responsive"))
| coefficient | Std.Error | t value | p value | |
|---|---|---|---|---|
| (Intercept) | 137.3347651 | 55.0536680 | 2.4945616 | 0.0144363 |
| size | -0.0040249 | 0.0337734 | -0.1191744 | 0.9054028 |
| new | 103.9437238 | 104.9927628 | 0.9900085 | 0.3248242 |
| beds | -58.5224497 | 24.9170037 | -2.3486953 | 0.0210288 |
| baths | 16.1307475 | 24.2446284 | 0.6653328 | 0.5075391 |
| size:new | 0.1052308 | 0.0304904 | 3.4512732 | 0.0008517 |
| size:baths | -0.0027713 | 0.0143378 | -0.1932839 | 0.8471722 |
| size:beds | 0.0332043 | 0.0136143 | 2.4389345 | 0.0166933 |
| new:baths | -104.4784463 | 51.4122410 | -2.0321706 | 0.0450842 |
| new:beds | -10.4855587 | 39.9372837 | -0.2625506 | 0.7934970 |
| Adjusted R square |
|---|
| 0.7638635 |
모델 피팅 결과 수정된 결정계수는 0.764이고 size:baths 교호작용이 유의하지 않아 이를 제거하고 다시 결과를 보기로 한다.
fit5 <- lm(price ~ size + new + beds + baths + size*new + size*beds + new*baths + new*beds, data=Houses)
sum_fit5 <- summary(fit5)
sum_fit5_m <- data.frame(sum_fit5$coefficients)%>%
  rename("coefficient"="Estimate","Std.Error"="Std..Error","t value"="t.value","p value"="Pr...t..")%>%
  kable(caption = "Summary of fit5",booktabs = TRUE, valign = 't')%>%
  kable_styling(bootstrap_options = c("striped", "hover", "condensed", "responsive"))
sum_fit5_m
sum_fit5$adj.r.squared%>%
  data.frame()%>%
  rename("Adjusted R square"=".")%>%
  kable(caption = "Adjusted R square",booktabs = TRUE, valign = 't')%>%
  kable_styling(bootstrap_options = c("striped", "hover", "condensed", "responsive"))
| coefficient | Std.Error | t value | p value | |
|---|---|---|---|---|
| (Intercept) | 136.8890773 | 54.7136472 | 2.5019183 | 0.0141390 |
| size | -0.0049199 | 0.0332771 | -0.1478456 | 0.8827917 |
| new | 107.0270663 | 103.2234538 | 1.0368483 | 0.3025539 |
| beds | -55.1543840 | 17.7159218 | -3.1132664 | 0.0024734 |
| baths | 12.0963336 | 12.2682844 | 0.9859841 | 0.3267552 |
| size:new | 0.1060439 | 0.0300386 | 3.5302531 | 0.0006536 |
| size:beds | 0.0312882 | 0.0092818 | 3.3709137 | 0.0011010 |
| new:baths | -107.9387245 | 47.9389790 | -2.2515858 | 0.0267551 |
| new:beds | -9.4895123 | 39.3933841 | -0.2408910 | 0.8101815 |
| Adjusted R square |
|---|
| 0.7663615 |
모델 피팅 결과 수정된 결정계수는 0.766이고 new:beds 교호작용이 유의하지 않아 이를 제거하고 다시 결과를 보기로 한다.
fit6 <- lm(price ~ size + new + baths + beds + size*new+size*beds+new*baths, data=Houses)
sum_fit6 <- summary(fit6)
sum_fit6_m <- data.frame(sum_fit6$coefficients)%>%
  rename("coefficient"="Estimate","Std.Error"="Std..Error","t value"="t.value","p value"="Pr...t..") %>%
  kable(caption = "Summary of fit6",booktabs = TRUE, valign = 't')%>%
  kable_styling(bootstrap_options = c("striped", "hover", "condensed", "responsive"))
sum_fit6_m;sum_fit6$adj.r.squared%>% data.frame() %>%
  rename("Adjusted R square"=".")%>%
  kable(caption = "Adjusted R square",booktabs = TRUE, valign = 't')%>%
  kable_styling(bootstrap_options = c("striped", "hover", "condensed", "responsive"))
| coefficient | Std.Error | t value | p value | |
|---|---|---|---|---|
| (Intercept) | 135.6459351 | 54.1901588 | 2.5031470 | 0.0140733 |
| size | -0.0031778 | 0.0323150 | -0.0983366 | 0.9218789 |
| new | 90.7242029 | 77.5413408 | 1.1700108 | 0.2450187 |
| baths | 12.2813031 | 12.1813868 | 1.0082024 | 0.3160017 |
| beds | -55.0541117 | 17.6201276 | -3.1245013 | 0.0023826 |
| size:new | 0.1039833 | 0.0286470 | 3.6298074 | 0.0004659 |
| size:beds | 0.0308547 | 0.0090589 | 3.4059907 | 0.0009790 |
| new:baths | -111.5443866 | 45.3085824 | -2.4618821 | 0.0156842 |
| Adjusted R square |
|---|
| 0.7687537 |
모델 피팅 결과 수정된 결정계수는 0.769로 조금 높아졌으며, interaction terms는 모두 유의하게 나왔다.
new:baths를 제거한 모델을 fit7로 두고 결과를 확인하여 보면
fit7 <- lm(price ~ size + new + baths + beds + size*new+size*beds, data=Houses)
sum_fit7 <- summary(fit7)
sum_fit7_m <- data.frame(sum_fit7$coefficients)%>%
  rename("coefficient"="Estimate","Std.Error"="Std..Error","t value"="t.value","p value"="Pr...t..") %>%
  kable(caption = "Summary of fit7",booktabs = TRUE, valign = 't')%>%
  kable_styling(bootstrap_options = c("striped", "hover", "condensed", "responsive"))
sum_fit7_m;sum_fit7$adj.r.squared%>% data.frame() %>% rename("Adjusted R square"=".")%>%
  kable(caption = "Adjusted R square",booktabs = TRUE, valign = 't')%>%
  kable_styling(bootstrap_options = c("striped", "hover", "condensed", "responsive"))
| coefficient | Std.Error | t value | p value | |
|---|---|---|---|---|
| (Intercept) | 138.8243136 | 55.6292903 | 2.4955255 | 0.0143395 |
| size | 0.0054143 | 0.0329886 | 0.1641276 | 0.8699869 |
| new | -58.3989591 | 49.7104136 | -1.1747832 | 0.2430807 |
| baths | 4.8119196 | 12.1142428 | 0.3972118 | 0.6921215 |
| beds | -53.9900315 | 18.0877576 | -2.9848936 | 0.0036245 |
| size:new | 0.0550254 | 0.0211737 | 2.5987665 | 0.0108796 |
| size:beds | 0.0297523 | 0.0092908 | 3.2023436 | 0.0018666 |
| Adjusted R square |
|---|
| 0.7561697 |
수정된 결정계수가 0.756으로 조금 줄어들었다.
따라서 효과가 그렇게 크진 않은 것을 볼 수 있다.
interaction terms는 유의하지만 main effect size, new, baths가 유의하지 않으므로 우선 baths 변수를 제거하여보겠다.
main effect가 제거되었는데 interaction term이 존재할 수는 없다.
fit8 <- update(fit7, .~. - baths, data=Houses)
sum_fit8 <- summary(fit8)
sum_fit8_m <- data.frame(sum_fit8$coefficients)%>%
  rename("coefficient"="Estimate","Std.Error"="Std..Error","t value"="t.value","p value"="Pr...t..")%>%
  kable(caption = "Summary of fit8",booktabs = TRUE, valign = 't')%>%
  kable_styling(bootstrap_options = c("striped", "hover", "condensed", "responsive"))
sum_fit8_m

sum_fit8$adj.r.squared%>%
  data.frame()%>%
  rename("Adjusted R square"=".")%>%
  kable(caption = "Adjusted R square",booktabs = TRUE, valign = 't')%>%
  kable_styling(bootstrap_options = c("striped", "hover", "condensed", "responsive"))
| coefficient | Std.Error | t value | p value | |
|---|---|---|---|---|
| (Intercept) | 143.4709850 | 54.1411901 | 2.6499415 | 0.0094457 |
| size | 0.0068404 | 0.0326454 | 0.2095377 | 0.8344820 |
| new | -56.6857817 | 49.3005986 | -1.1497991 | 0.2531436 |
| beds | -53.6373359 | 17.9848343 | -2.9823648 | 0.0036429 |
| size:new | 0.0544088 | 0.0210219 | 2.5881984 | 0.0111785 |
| size:beds | 0.0300206 | 0.0092246 | 3.2544107 | 0.0015798 |
| Adjusted R square |
|---|
| 0.7583544 |
fit8 결과, interaction terms는 모두 유의한 결과를 보이지만 main effect인 size와 new는 유의하지 않게 나왔다.
interaction terms를 모두 제거하고 size와 new 변수만으로 모델을 만들어 수정된 결정계수값을 확인하여 보면 0.7168767의 값으로 줄어든다.
우선 fit8모형을 provisional model로 설정하여 해석하여 보겠다.
100 square foot 증가함에 따라서 집의 예상 판매 가격은
older two-bedroom home의 경우 100[0.00684 + 0 + 2(0.03002)], 약 $6,688 증가한다.
older three-bedroom home의 경우 100[0.00684 + 0 +3(0.03002)], 약 $9,690 증가한다.
older four-bedroom home의 경우 100[0.00684 + 0 + 4(0.03002)], 약 $12,692 증가한다.
new home의 경우, 이 세 가지 값에 각각 +$5441달러가 된다.
bedrooms 수에 따라 조정된 new 집의 예상 판매 가격에 대한 효과는
−56.686+ 1000(0.0544), 약 −$2277, for a 1000-square-foot home,
−56.686+ 2000(0.0544), 약 $52,132, for a 2000- square-foot home,
−56.686+ 3000(0.0544), 약 $106,541 for a 3000-square- foot home.
new 집에 따라 조정된 추가 bedrooms의 예상 판매 가격에 대한 효과는
−53.637+ 1000(0.0300),or−$23,616, for a 1000-square- foot home,
−53.637+ 2000(0.0300), or $6405, for a 2000-square-foot home,
−53.637+ 3000(0.0300), or$36,426, for a3000-square-foot home.
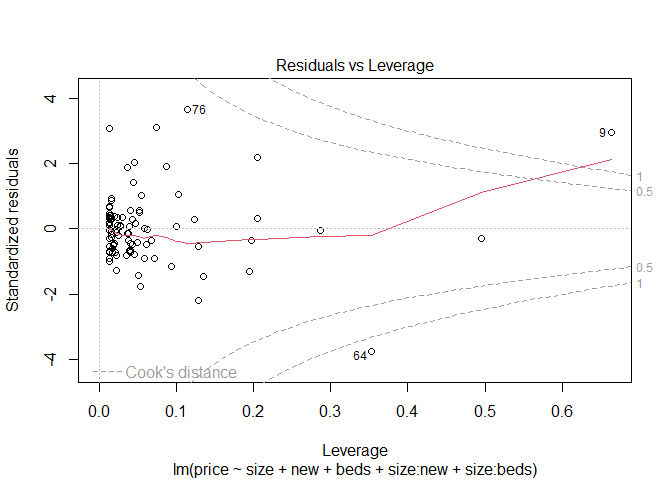
이를 시각적으로 표현하기 위해 QQ plot과 fitted value와 표준화 잔차의 그림 및 잔차플롯을 보이면 다음과 같다.
plot(fit8)


fit8에서 beds변수를 제거한 모형을 fit9라고 하겠다.
fit9 <- lm(formula = price ~ size + new + size:new, data=Houses)
sum_fit9 <- summary(fit9)
sum_fit9_m <- data.frame(sum_fit9$coefficients)%>%
  rename("coefficient"="Estimate","Std.Error"="Std..Error","t value"="t.value","p value"="Pr...t..")%>%
  kable(caption = "Summary of fit9",booktabs = TRUE, valign = 't')%>%
  kable_styling(bootstrap_options = c("striped", "hover", "condensed", "responsive"))
sum_fit9_m

sum_fit9$adj.r.squared%>%
  data.frame() %>%
  rename("Adjusted R square"=".")%>%
  kable(caption = "Adjusted R square",booktabs = TRUE, valign = 't')%>%
  kable_styling(bootstrap_options = c("striped", "hover", "condensed", "responsive"))
| coefficient | Std.Error | t value | p value | |
|---|---|---|---|---|
| (Intercept) | -22.2278079 | 15.5211100 | -1.432102 | 0.1553627 |
| size | 0.1044384 | 0.0094241 | 11.082080 | 0.0000000 |
| new | -78.5275023 | 51.0076419 | -1.539524 | 0.1269661 |
| size:new | 0.0619159 | 0.0216857 | 2.855149 | 0.0052716 |
| Adjusted R square |
|---|
| 0.7363181 |
adjusted R²=0.736으로 조금 작아진다.
fit9는 모형이 단순화 되므로 해석하기에 편리해진다.
\[\hat{\mu} \ = \ −22.228 \ + \ 0.1044(size) \ −78.5275(new) \ + \ 0.0619(size∗new)\]
다음은 이전에 확인하여 본 fit1~fit9 중 BIC가 fit8에서 가장 작은지 코드를 작성해서 확인하여 보았다.
fit1 <- lm(price ~ size + new + baths + beds)
fit2 <- lm(price ~ (size + new + baths + beds)^2)
fit3 <- lm(price ~ (size + new + baths + beds)^3)
fit4 <- lm(price ~ size + new + beds + baths + size:new + size:baths + size:beds + new:baths + new:beds)
fit5 <- lm(price ~ size + new + beds + baths + size:new + size:beds + new:baths + new:beds)
fit6 <- lm(price ~ size + new + baths + beds + size:new + size:beds + new:baths)
fit7 <- lm(price ~ size + new + baths + beds + size:new + size:beds)
fit8 <- lm(price ~ size + new + beds + size:new + size:beds)
fit9 <- lm(price ~ size + new + size:new)
bic <- c()
for (i in 1:9){
  bic <-c(bic,BIC(eval(parse(text=paste0("fit",c(1:9))[i]))))
}
data.frame(bic)%>%
  rename("BIC"="bic")%>%
  kable(caption = "",booktabs = TRUE, valign = 't')%>%
  kable_styling(bootstrap_options = c("striped", "hover", "condensed", "responsive"))
| BIC |
|---|
| 1105.022 |
| 1107.719 |
| 1117.213 |
| 1103.117 |
| 1098.553 |
| 1094.012 |
| 1095.786 |
| 1091.351 |
| 1092.973 |
which.min(bic)
## [1] 8
min(bic)
## [1] 1091.351
위의 과정을 step() 함수를 사용하여 Backward Elimination을 계산할 수 있다.
여기서 중요한 것은 step() 함수에서 출력되는 AIC 값은 TRUE 값이 아니다.
(상수값이 제대로 곱해져 있는 값이 아니다.)
R에서 AIC 함수를 사용하면 정확한 값을 준다.
step(lm(price ~ (size + new + beds + baths)^2, data=Houses))
## Start:  AIC=790.67
## price ~ (size + new + beds + baths)^2
##
##              Df Sum of Sq    RSS    AIC
## - beds:baths  1       5.3 217922 788.67
## - size:baths  1      92.0 218008 788.71
## - new:beds    1     165.6 218082 788.75
## <none>                    217916 790.67
## - size:beds   1    9523.7 227440 792.95
## - new:baths   1    9927.4 227844 793.12
## - size:new    1   28819.5 246736 801.09
##
## Step:  AIC=788.67
## price ~ size + new + beds + baths + size:new + size:beds + size:baths +
##     new:beds + new:baths
##
##              Df Sum of Sq    RSS    AIC
## - size:baths  1      90.5 218012 786.71
## - new:beds    1     166.9 218089 786.75
## <none>                    217922 788.67
## - new:baths   1    9999.5 227921 791.16
## - size:beds   1   14403.2 232325 793.07
## - size:new    1   28841.4 246763 799.10
##
## Step:  AIC=786.71
## price ~ size + new + beds + baths + size:new + size:beds + new:beds +
##     new:baths
##
##             Df Sum of Sq    RSS    AIC
## - new:beds   1       139 218151 784.78
## <none>                   218012 786.71
## - new:baths  1     12146 230158 790.13
## - size:beds  1     27223 245235 796.48
## - size:new   1     29857 247869 797.55
##
## Step:  AIC=784.78
## price ~ size + new + beds + baths + size:new + size:beds + new:baths
##
##             Df Sum of Sq    RSS    AIC
## <none>                   218151 784.78
## - new:baths  1     14372 232523 789.16
## - size:beds  1     27508 245659 794.65
## - size:new   1     31242 249393 796.16

##
## Call:
## lm(formula = price ~ size + new + beds + baths + size:new + size:beds +
##     new:baths, data = Houses)
##
## Coefficients:
## (Intercept)         size          new         beds        baths     size:new
##   1.356e+02   -3.178e-03    9.072e+01   -5.505e+01    1.228e+01    1.040e-01
##   size:beds    new:baths
##   3.085e-02   -1.115e+02
결과를 보면 fit6 에서 AIC 값이 가장 작은 값을 가지는 것을 확인할 수 있으며,
BIC는 fit 8에서 가장 작은 값을 준다.
위에서 주어진 AIC=784.78은 TRUE값이 아니다.
aic <- AIC(lm(price ~ size+new+beds+baths+size:new+size:beds+new:baths, data=Houses))
bic <- BIC(lm(price ~ size + new + beds + size:new + size:beds, data=Houses)) # this is model with lowest BIC
data.frame(aic,bic)%>%
  rename("AIC"="aic","BIC"="bic")%>%
  kable(caption = "",booktabs = TRUE, valign = 't')%>%
  kable_styling(bootstrap_options = c("striped", "hover", "condensed", "responsive"))
| AIC | BIC |
|---|---|
| 1070.565 | 1091.351 |
AIC(Akaike information criterion) 및 BIC(Baysian information criterion) 값을 구하여 모델이 얼마나 잘 적합이 되었는지 판단할 수 있다.
AIC 여러개 비교해서 가장 작은 값을 주는 모형 선택,
AIC는 복잡한 모형을 주는 경향이 있고 (AIC tends to produce ovefit models.)
BIC는 덜 복잡한 모형을 주는 경향이 있다. (BIC tends to produce underfit models.)
집 값은 엄밀하게 말하면 대부분 positive 값을 가진다.
정규분포 가정한 일반선형모형은 적절하지 않을 수 있다.
ggplot(data = Houses, aes(x = price))+
  geom_histogram(aes(y=..density..),binwidth=10,color="#ffffb3", fill="#8dd3c7")+
  geom_density(alpha=0.3, color="#ffffb3", fill="#CED46A")

따라서 Gamma GLM을 적합시켜 보도록 하겠다.
- Gamma GLMs for House Selling Pride Data
\[\begin{align} f(y:k,\mu)=\frac{y^{k-1}}{\Gamma(k)(\frac{\mu}{k})^k}e^{-\frac{y}{\mu/k}}, \ y \geq 0, \ k>0 \\ for \ which \ E(y)= \mu, \ var(y) = \mu^2/k \end{align}\]기존에 알던 감마분포와는 형태가 다르게 scale parameter가 \(E(y)= \mu\)되도록 reparametrization해주었다.
Gamma GLMs usually assume k to be constant but unknown
관심있는 모수는 k가 아닌 \(\mu\)에 있기 때문에 k가 알려져 있지는 않지만 nuisance parameter로 보고 k는 constant라고 하겠다.
\[f(y_i:\theta_i,\phi)=exp(\frac{y_i\theta_i-b(\theta_i)}{a(\phi)}+c(y_i,\phi))\]지수족의 형태는 다음과 같다.
\[f(y:k,\mu)=exp \bigg\{ \frac{-\frac{y}{\mu}-\big(-log(-\theta)\big)}{1/k}+c(y_i,\phi) \bigg\}, \ \theta=-\frac{1}{\mu}, \ b(\theta)=-log(-\theta), \ a(\phi)=\frac{1}{k}\]위에 정의한 감마분포가 다음의 식으로 지수족을 따르는 것을 볼 수 있다.
감마분포를 가정한 상태에서 glm 모형을 적합시켜보도록 한다.
fit.gamma <- glm(price ~ size + new + beds + size:new + size:beds, family = Gamma(link = identity), data=Houses)
sum_g <- summary(fit.gamma)
sum_g_m<- data.frame(sum_g$coef)%>%
  rename("coefficient"="Estimate","Std.Error"="Std..Error","t value"="t.value","p value"="Pr...t..") %>%
  kable(caption = "Summary",booktabs = TRUE, valign = 't')%>%
  kable_styling(bootstrap_options = c("striped", "hover", "condensed", "responsive"))
sum_g_m
| coefficient | Std.Error | t value | p value | |
|---|---|---|---|---|
| (Intercept) | 44.3758986 | 48.5978445 | 0.9131248 | 0.3635130 |
| size | 0.0739797 | 0.0399989 | 1.8495416 | 0.0675219 |
| new | -60.0290457 | 65.7655129 | -0.9127739 | 0.3636966 |
| beds | -22.7131117 | 17.6312435 | -1.2882308 | 0.2008276 |
| size:new | 0.0538329 | 0.0375809 | 1.4324543 | 0.1553310 |
| size:beds | 0.0100000 | 0.0125590 | 0.7962412 | 0.4278982 |
이전에 fit8을 피팅시킨 것과 동일한 조건을 주었으나 이전에는 interaction terms이 유의하였지만 Gamma GLM에서는 유의하지 않은 결과를 보여준다.
2차 교호작용이 추가된 모델과 원모델을 비교하여 차이가 있는지 검정해보면 결과는 다음과 같다.
fit.g1 <- glm(price ~ size + new + baths + beds, family=Gamma(link=identity),data=Houses)
fit.g2 <- glm(price~(size + new + baths + beds)^2,family=Gamma(link=identity),data=Houses)
anova(fit.g1, fit.g2, test="F") %>%
  kable(caption = "Result of F test",booktabs = TRUE, valign = 't')%>%
  kable_styling(bootstrap_options = c("striped", "hover", "condensed", "responsive"))
| Resid. Df | Resid. Dev | Df | Deviance | F | Pr(>F) |
|---|---|---|---|---|---|
| 95 | 10.441719 | NA | NA | NA | NA |
| 89 | 9.872775 | 6 | 0.568944 | 0.8437596 | 0.5395703 |
검정 결과 p-value=0.539로 유의수준 0.05보다 크므로 유의하지 않다.
그러므로 교호작용은 필요없다고 할 수 있다.
size와 new의 교호작용만 넣었을 때의 모델을 Gamma glm 모형으로 적합했을 때와 일반 glm모형으로 적합한 경우의 결과를 비교해보면 다음과 같다.
fit_gam1 <- summary(glm(price ~ size + new + size:new, family=Gamma(link=identity), data=Houses))
fit_gam1_m <- data.frame(fit_gam1$coefficients)%>%
  rename("coefficient"="Estimate","Std.Error"="Std..Error","t value"="t.value","p value"="Pr...t..") %>%
  kable(caption = "Summary of Gamma glm",booktabs = TRUE, valign = 't')%>%
  kable_styling(bootstrap_options = c("striped", "hover", "condensed", "responsive"))

fit_lm1 <- summary(lm(price ~ size + new + size:new,dat=Houses))
fit_lm1_m <- data.frame(fit_lm2$coefficients)%>%
  rename("coefficient"="Estimate","Std.Error"="Std..Error","t value"="t.value","p value"="Pr...t..") %>%
  kable(caption = "Summary of normal linear glm",booktabs = TRUE, valign = 't')%>%
  kable_styling(bootstrap_options = c("striped", "hover", "condensed", "responsive"))

fit_gam1_m; fit_lm1_m
| coefficient | Std.Error | t value | p value | |
|---|---|---|---|---|
| (Intercept) | -7.4521938 | 12.9738404 | -0.5744015 | 0.5670397 |
| size | 0.0944569 | 0.0100525 | 9.3963533 | 0.0000000 |
| new | -77.9033275 | 64.5827183 | -1.2062566 | 0.2306829 |
| size:new | 0.0649207 | 0.0367047 | 1.7687290 | 0.0801153 |
| coefficient | Std.Error | t value | p value | |
|---|---|---|---|---|
| (Intercept) | -22.2278079 | 15.5211100 | -1.432102 | 0.1553627 |
| size | 0.1044384 | 0.0094241 | 11.082080 | 0.0000000 |
| new | -78.5275023 | 51.0076419 | -1.539524 | 0.1269661 |
| size:new | 0.0619159 | 0.0216857 | 2.855149 | 0.0052716 |
fit_gam1_AIC <- AIC(glm(price ~ size + new + size:new, family=Gamma(link=identity), data=Houses))
fit_lm1_AIC <- AIC(lm(price ~ size + new + size:new,dat=Houses))

data.frame(fit_gam1_AIC,fit_lm1_AIC)%>%
  rename("AIC of Gamma glm"="fit_gam1_AIC","AIC of Normal linear glm"="fit_lm1_AIC")%>%
  kable(caption = "",booktabs = TRUE, valign = 't')%>%
  kable_styling(bootstrap_options = c("striped", "hover", "condensed", "responsive"))
| AIC of Gamma glm | AIC of Normal linear glm |
|---|---|
| 1047.935 | 1079.947 |
감마분포를 가정한 모델 적합 결과를 시각적으로 보기위한 그림들은 다음과 같다.
plot(glm(price ~ size + new + size:new, family=Gamma(link=identity), data=Houses))


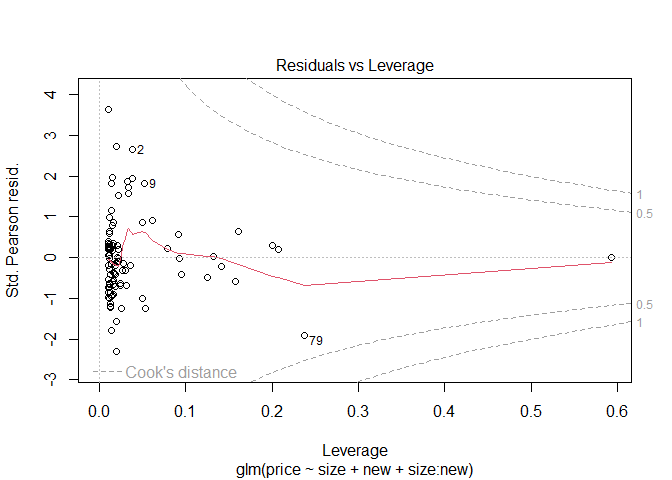
위의 결과를 보아 효과들은 전체적으로 비슷하지만 감마분포를 가정했을 때 interaction term에서 더 큰 SE 값을 가지고 있는다.
\(\phi\)가 추정되어야 k를 추정할 수 있으며 또한 분산을 추정할수 있기 때문에 \(\phi\)를 추정해보도록 한다.
sas프로그램 같은 경우 dispersion parameter \(\phi\)를 MLE 방법으로 추정하는데, MLE를 사용하면 문제가 있을 수 있다.
variance function이 정확하지 않으면 MLE값이 inconsistent하기 때문이다.
(the ML estimator is inconsistent if the variance function is correct but the distribution is not truly the assumed one (McCullagh and Nelder 1989, p. 295))
\[\hat{\phi}=\frac{X^2}{(n-p)}=\frac{1}{n-p} \sum^n_{i=1}\frac{(y_i-\hat{\mu_i})^2}{\hat{\mu_i}^2}\]R 프로그램 같은 경우 \(\phi\)를 Pearson staistic을 이용해서 추정한다.
fit_gam1 <- summary(glm(price ~ size+new+size:new, family=Gamma(link=identity), data=Houses))
fit_gam1$dispersion
## [1] 0.1102068
이 감마 모델에서 dispersion parameter \(\hatϕ=0.11021\) 이며 그렇게 추정된 shape parameter \(k=\frac{1}{\hat{ϕ}}=9.07\)이다.
\[Var(y_i)=b^{''}(\theta_i)a(\phi)\]지수족에서 분산구하는 식은 다음과 같다.
\[\hat \sigma = \sqrt{\hatϕ}\hat\mu = 0.33197 \hat \mu\]위 식으로 추정된 standard deviation은 다음과 같이 구해진다.
식을 통해 \(\mu\)가 커짐에 따라 \(\sigma\)도 커지는 관계를 볼 수 있다.
따라서 \(E(y_i)\)에만 초점을 두는 것이 아닌 \(Var(y_i)\)가 어떻게 변화되는지도 관심을 가져야 한다.
aic1 <- AIC(lm(price ~ size + new + size:new, data=Houses))
aic2 <- AIC(lm(price ~ size +new +beds +baths +size:new +size:beds +new:baths, data=Houses))
aic3 <- AIC(glm(price ~ size + new + size:new,family=Gamma(link=identity), data=Houses))

data.frame(aic1,aic2,aic3)%>% rename("size+new+size:new"="aic1","size +new +beds +baths +size:new +size:beds +new:baths"="aic2","size+new+size:new (Gamma)"="aic3")%>%
  kable(caption = "AIC",booktabs = TRUE, valign = 't')%>%
  kable_styling(bootstrap_options = c("striped", "hover", "condensed", "responsive"))
| size+new+size:new | size +new +beds +baths +size:new +size:beds +new:baths | size+new+size:new (Gamma) |
|---|---|---|
| 1079.947 | 1070.565 | 1047.935 |
AIC를 구한 결과 Gamma glm을 적합시켰을 때 모델의 AIC 값이 1047.9로써 앞서 구한 값들보다 작다는 것을 알 수 있다.
link function을 log link를 사용한 결과도 한 번 확인하여 보자.
fit1 <- glm(price ~ size + new + baths + beds, family=Gamma(link=log), data=Houses)
fit2 <- glm(price ~ (size + new + baths + beds)^2, family=Gamma(link=log), data= Houses)
fit3 <- glm(price ~ (size + new + baths + beds)^3, family=Gamma(link=log), data=Houses)
fit4 <- glm(price ~ size + new + beds + baths + size*new + size*baths + size*beds + new*baths + new*beds, family=Gamma(link=log), data=Houses)
fit5 <- glm(price ~ size + new + beds + baths + size*new + size*beds + new*baths + new*beds, family=Gamma(link=log), data=Houses)
fit6 <- glm(price ~ size + new + beds + baths + size*new + size*beds + new*baths, family=Gamma(link=log), data=Houses)
fit7 <- glm(price ~ size + new + beds + baths + size*new + size*beds, family=Gamma(link=log), data=Houses)
fit8 <- update(fit7, .~. - baths, family=Gamma(link=log), data=Houses)
fit9 <- glm(formula = price ~ size + new + size:new, family=Gamma(link=log), data=Houses)

step(glm(price ~ (size + new + baths + beds)^2, family=Gamma(link=log), data= Houses), data=Houses)
## Start:  AIC=1059.01
## price ~ (size + new + baths + beds)^2
##
##              Df Deviance    AIC
## - new:beds    1   10.268 1057.0
## - new:baths   1   10.270 1057.1
## - size:beds   1   10.289 1057.2
## - size:new    1   10.291 1057.3
## - baths:beds  1   10.354 1057.8
## <none>            10.264 1059.0
## - size:baths  1   10.691 1060.8
##
## Step:  AIC=1057.06
## price ~ size + new + baths + beds + size:new + size:baths + size:beds +
##     new:baths + baths:beds
##
##              Df Deviance    AIC
## - new:baths   1   10.280 1055.2
## - size:beds   1   10.290 1055.2
## - size:new    1   10.291 1055.3
## - baths:beds  1   10.358 1055.9
## <none>            10.268 1057.1
## - size:baths  1   10.693 1058.9
##
## Step:  AIC=1055.18
## price ~ size + new + baths + beds + size:new + size:baths + size:beds +
##     baths:beds
##
##              Df Deviance    AIC
## - size:new    1   10.291 1053.3
## - size:beds   1   10.308 1053.4
## - baths:beds  1   10.376 1054.0
## <none>            10.280 1055.2
## - size:baths  1   10.808 1058.0
##
## Step:  AIC=1053.29
## price ~ size + new + baths + beds + size:baths + size:beds +
##     baths:beds
##
##              Df Deviance    AIC
## - size:beds   1   10.321 1051.6
## - baths:beds  1   10.379 1052.1
## <none>            10.291 1053.3
## - new         1   10.634 1054.5
## - size:baths  1   10.808 1056.0
##
## Step:  AIC=1051.58
## price ~ size + new + baths + beds + size:baths + baths:beds
##
##              Df Deviance    AIC
## <none>            10.321 1051.6
## - baths:beds  1   10.550 1051.7
## - new         1   10.644 1052.6
## - size:baths  1   10.811 1054.2

##
## Call:  glm(formula = price ~ size + new + baths + beds + size:baths +
##     baths:beds, family = Gamma(link = log), data = Houses)
##
## Coefficients:
## (Intercept)         size          new        baths         beds   size:baths
##   4.0413287    0.0010923    0.2023428    0.0088916   -0.3545010   -0.0002175
##  baths:beds
##   0.1465839
##
## Degrees of Freedom: 99 Total (i.e. Null);  93 Residual
## Null Deviance:       31.94
## Residual Deviance: 10.32     AIC: 1052
step() 함수 결과
glm(price ~ size + new + baths + beds + size:baths + baths:beds, family = Gamma(link = log)
모형이 선택 되었다.
aic <- AIC(glm(formula = price ~ size + new + baths + beds + size:baths +
        baths:beds, family = Gamma(link = log), data = Houses))
bic <- BIC(glm(formula = price ~ size + new + baths + beds + size:baths +
          baths:beds, family = Gamma(link = log), data = Houses))
data.frame(aic,bic)%>% rename("AIC"="aic","BIC"="bic")%>%
  kable(caption = "",booktabs = TRUE, valign = 't')%>%
  kable_styling(bootstrap_options = c("striped", "hover", "condensed", "responsive"))
| AIC | BIC |
|---|---|
| 1051.582 | 1072.424 |
이전의 identity link function을 사용했을 때보다 값이 큰 것을 볼 수 있다.
fit1~fit9에서 AIC와 BIC의 최소값을 확인하여 보자.
#aic 구하기
aic <- c()
for (i in 1:9){
  aic <-c(aic,AIC(eval(parse(text=paste0("fit",c(1:9))[i]))))
}
data.frame(aic)%>%
  rename("AIC"="aic")%>%
  kable(caption = "",booktabs = TRUE, valign = 't')%>%
  kable_styling(bootstrap_options = c("striped", "hover", "condensed", "responsive"))
| AIC |
|---|
| 1052.470 |
| 1059.012 |
| 1065.244 |
| 1057.909 |
| 1059.163 |
| 1057.180 |
| 1056.288 |
| 1055.296 |
| 1051.556 |
which.min(aic)
## [1] 9
min(aic)
## [1] 1051.556
AIC의 값은 fit9에서 가장 작은 값이 나왔으며,
#bic구하기
bic <- c()
for (i in 1:9){
  bic <-c(bic,BIC(eval(parse(text=paste0("fit",c(1:9))[i]))))
}
data.frame(bic)%>% rename("BIC"="bic")%>%
  kable(caption = "",booktabs = TRUE, valign = 't')%>%
  kable_styling(bootstrap_options = c("striped", "hover", "condensed", "responsive"))
| BIC |
|---|
| 1068.101 |
| 1090.274 |
| 1106.926 |
| 1086.565 |
| 1085.215 |
| 1080.627 |
| 1077.130 |
| 1073.532 |
| 1064.582 |
which.min(bic)
## [1] 9
min(bic)
## [1] 1064.582
BIC도 fit9에서 가장 작은 값이 나왔다.
하지만 log link 보다 identity link가 AIC, BIC 둘 다 작은 값을 주는 것을 확인할 수 있다.
\[E(price) = -7.4521938 + 0.0944569 * size -77.9033275 * new + 0.0649207 * (size:new)\]최종 모델식을 다음과 같이 구했다.
Q-5

데이터셋 설명
auto <- read.csv("C:/Biostat/Categorical data analysis/Assignment 2/Auto.csv")
head(auto)%>%
  kable(caption = "Auto dataset",booktabs = TRUE, valign = 't')%>%
  kable_styling(bootstrap_options = c("striped", "hover", "condensed", "responsive"))
| mpg | cylinders | displacement | horsepower | weight | acceleration | year | origin | name |
|---|---|---|---|---|---|---|---|---|
| 18 | 8 | 307 | 130 | 3504 | 12.0 | 70 | 1 | chevrolet chevelle malibu |
| 15 | 8 | 350 | 165 | 3693 | 11.5 | 70 | 1 | buick skylark 320 |
| 18 | 8 | 318 | 150 | 3436 | 11.0 | 70 | 1 | plymouth satellite |
| 16 | 8 | 304 | 150 | 3433 | 12.0 | 70 | 1 | amc rebel sst |
| 17 | 8 | 302 | 140 | 3449 | 10.5 | 70 | 1 | ford torino |
| 15 | 8 | 429 | 198 | 4341 | 10.0 | 70 | 1 | ford galaxie 500 |
str(auto)
## 'data.frame':    397 obs. of  9 variables:
##  $ mpg         : num  18 15 18 16 17 15 14 14 14 15 ...
##  $ cylinders   : int  8 8 8 8 8 8 8 8 8 8 ...
##  $ displacement: num  307 350 318 304 302 429 454 440 455 390 ...
##  $ horsepower  : chr  "130" "165" "150" "150" ...
##  $ weight      : int  3504 3693 3436 3433 3449 4341 4354 4312 4425 3850 ...
##  $ acceleration: num  12 11.5 11 12 10.5 10 9 8.5 10 8.5 ...
##  $ year        : int  70 70 70 70 70 70 70 70 70 70 ...
##  $ origin      : int  1 1 1 1 1 1 1 1 1 1 ...
##  $ name        : chr  "chevrolet chevelle malibu" "buick skylark 320" "plymouth satellite" "amc rebel sst" ...
mpg
miles per galloncylinders
Number of cylinders between 4 and 8displacement
Engine displacement (cu. inches)horsepower
Engine horsepowerweight
Vehicle weight (lbs.)acceleration
Time to accelerate from 0 to 60 mph (sec.)year
Model year (modulo 100)origin
Origin of car (1. American, 2. European, 3. Japanese)name
Vehicle name
auto$horsepower <- as.integer(auto$horsepower)
auto$origin <- as.factor(auto$origin)
table(is.na(auto$horsepower))
##
## FALSE  TRUE
##   392     5
auto1 <- na.omit(auto)
table(is.na(auto1$horsepower))
##
## FALSE
##   392
#70년도 기준으로
auto1$year_70 <- auto1$year-70

auto1$mpg_G <- as.integer(auto1$mpg_G)

attach(auto1)
데이터에서 5개의 결측치를 확인하여 제거하였다.
year변수는 해석의 용이성을 위하여 70년도를 기준으로 잡아서 변환하였다.
감마분포를 identity link function을 사용하여 모델을 적합하여 보았다.
autoModel1 <- glm(mpg ~ cylinders + displacement + horsepower + weight + acceleration + year + origin,family=Gamma(link=identity), data = auto1)

sum_autoModel1 <- summary(autoModel1)

data.frame(sum_autoModel1$coefficients)%>%
  rename("coefficient"="Estimate","Std.Error"="Std..Error","t value"="t.value","p value"="Pr...t..") %>%
  kable(caption = "Summary",booktabs = TRUE, valign = 't')%>%
  kable_styling(bootstrap_options = c("striped", "hover", "condensed", "responsive"))
| coefficient | Std.Error | t value | p value | |
|---|---|---|---|---|
| (Intercept) | -6.9914661 | 4.1618561 | -1.6798914 | 0.0937939 |
| cylinders | -1.0175197 | 0.2401963 | -4.2361999 | 0.0000285 |
| displacement | 0.0150055 | 0.0053463 | 2.8066974 | 0.0052610 |
| horsepower | -0.0146103 | 0.0086023 | -1.6984215 | 0.0902404 |
| weight | -0.0044375 | 0.0004858 | -9.1351003 | 0.0000000 |
| acceleration | -0.0716548 | 0.0824142 | -0.8694469 | 0.3851473 |
| year | 0.6289814 | 0.0479122 | 13.1277956 | 0.0000000 |
| origin2 | 2.2952714 | 0.5851585 | 3.9224780 | 0.0001039 |
| origin3 | 3.1732353 | 0.6059254 | 5.2370064 | 0.0000003 |
acceleration 유의수준 0.05하에 유의하지 않으므로 제거하여본다.
#acceleration 제거 (가속 시간)
autoModel2 <- glm(mpg ~ cylinders + displacement + horsepower + weight + year + origin,family=Gamma(link=identity), data = auto1)

sum_autoModel2 <- summary(autoModel2)

data.frame(sum_autoModel2$coefficients)%>%
  rename("coefficient"="Estimate","Std.Error"="Std..Error","t value"="t.value","p value"="Pr...t..") %>%
  kable(caption = "Summary",booktabs = TRUE, valign = 't')%>%
  kable_styling(bootstrap_options = c("striped", "hover", "condensed", "responsive"))
| coefficient | Std.Error | t value | p value | |
|---|---|---|---|---|
| (Intercept) | -8.0847731 | 3.9014388 | -2.072254 | 0.0389086 |
| cylinders | -1.0207784 | 0.2398625 | -4.255681 | 0.0000262 |
| displacement | 0.0168870 | 0.0049990 | 3.378061 | 0.0008047 |
| horsepower | -0.0115657 | 0.0077885 | -1.484981 | 0.1383693 |
| weight | -0.0046524 | 0.0004166 | -11.167644 | 0.0000000 |
| year | 0.6282056 | 0.0478828 | 13.119652 | 0.0000000 |
| origin2 | 2.3117006 | 0.5821908 | 3.970692 | 0.0000856 |
| origin3 | 3.2136699 | 0.6007731 | 5.349225 | 0.0000002 |
horsepower 유의수준 0.05하에 유의하지 않으므로 제거하여본다.
#horsepower 제거 (마력)
autoModel3 <- glm(mpg ~ cylinders + displacement + weight + year + origin,family=Gamma(link=identity), data = auto1)

sum_autoModel3 <- summary(autoModel3)

data.frame(sum_autoModel3$coefficients)%>%
  rename("coefficient"="Estimate","Std.Error"="Std..Error","t value"="t.value","p value"="Pr...t..") %>%
  kable(caption = "Summary",booktabs = TRUE, valign = 't')%>%
  kable_styling(bootstrap_options = c("striped", "hover", "condensed", "responsive"))
| coefficient | Std.Error | t value | p value | |
|---|---|---|---|---|
| (Intercept) | -9.8144398 | 3.7507780 | -2.616641 | 0.0092296 |
| cylinders | -0.9942088 | 0.2405499 | -4.133066 | 0.0000440 |
| displacement | 0.0131556 | 0.0044192 | 2.976905 | 0.0030957 |
| weight | -0.0047717 | 0.0004092 | -11.661219 | 0.0000000 |
| year | 0.6482069 | 0.0461945 | 14.032138 | 0.0000000 |
| origin2 | 2.2034301 | 0.5747313 | 3.833844 | 0.0001473 |
| origin3 | 3.0175976 | 0.5813852 | 5.190358 | 0.0000003 |
anova(autoModel2,autoModel1, test="LR")
## Analysis of Deviance Table
##
## Model 1: mpg ~ cylinders + displacement + horsepower + weight + year +
##     origin
## Model 2: mpg ~ cylinders + displacement + horsepower + weight + acceleration +
##     year + origin
##   Resid. Df Resid. Dev Df Deviance Pr(>Chi)
## 1       384     7.1136
## 2       383     7.0990  1 0.014657   0.3739
anova(autoModel3,autoModel2, test="LR")
## Analysis of Deviance Table
##
## Model 1: mpg ~ cylinders + displacement + weight + year + origin
## Model 2: mpg ~ cylinders + displacement + horsepower + weight + year +
##     origin
##   Resid. Df Resid. Dev Df Deviance Pr(>Chi)
## 1       385     7.1534
## 2       384     7.1136  1 0.039739   0.1428
link=identity일 때 autoModel3 선택
이번엔 link=log 사용하여 모델 적합하여 보자
autoModel4 <- glm(mpg ~ cylinders + displacement + horsepower + weight + acceleration + year + origin,family=Gamma(link=log), data = auto1)

sum_autoModel4 <- summary(autoModel4)

data.frame(sum_autoModel4$coefficients)%>%
  rename("coefficient"="Estimate","Std.Error"="Std..Error","t value"="t.value","p value"="Pr...t..") %>%
  kable(caption = "Summary",booktabs = TRUE, valign = 't')%>%
  kable_styling(bootstrap_options = c("striped", "hover", "condensed", "responsive"))
| coefficient | Std.Error | t value | p value | |
|---|---|---|---|---|
| (Intercept) | 1.6841944 | 0.1657891 | 10.1586574 | 0.0000000 |
| cylinders | -0.0271672 | 0.0113871 | -2.3857900 | 0.0175277 |
| displacement | 0.0008382 | 0.0002713 | 3.0897215 | 0.0021497 |
| horsepower | -0.0014860 | 0.0004859 | -3.0578526 | 0.0023859 |
| weight | -0.0002701 | 0.0000232 | -11.6294020 | 0.0000000 |
| acceleration | -0.0008582 | 0.0034817 | -0.2464855 | 0.8054385 |
| year | 0.0308849 | 0.0018357 | 16.8250009 | 0.0000000 |
| origin2 | 0.0907858 | 0.0200784 | 4.5215650 | 0.0000082 |
| origin3 | 0.0841496 | 0.0195935 | 4.2947664 | 0.0000222 |
#acceleration 제거 (가속 시간)
autoModel5 <- glm(mpg ~ cylinders + displacement + horsepower + weight + year + origin,family=Gamma(link=log), data = auto1)

sum_autoModel5 <- summary(autoModel5)

data.frame(sum_autoModel5$coefficients)%>%
  rename("coefficient"="Estimate","Std.Error"="Std..Error","t value"="t.value","p value"="Pr...t..") %>%
  kable(caption = "Summary",booktabs = TRUE, valign = 't')%>%
  kable_styling(bootstrap_options = c("striped", "hover", "condensed", "responsive"))
| coefficient | Std.Error | t value | p value | |
|---|---|---|---|---|
| (Intercept) | 1.6671534 | 0.1494095 | 11.158283 | 0.0000000 |
| cylinders | -0.0270358 | 0.0113562 | -2.380705 | 0.0177665 |
| displacement | 0.0008444 | 0.0002696 | 3.131999 | 0.0018693 |
| horsepower | -0.0014107 | 0.0003816 | -3.696577 | 0.0002503 |
| weight | -0.0002728 | 0.0000204 | -13.367065 | 0.0000000 |
| year | 0.0309126 | 0.0018278 | 16.912448 | 0.0000000 |
| origin2 | 0.0905918 | 0.0200486 | 4.518618 | 0.0000083 |
| origin3 | 0.0840086 | 0.0195645 | 4.293921 | 0.0000223 |
anova(autoModel5,autoModel4, test="LR")
## Analysis of Deviance Table
##
## Model 1: mpg ~ cylinders + displacement + horsepower + weight + year +
##     origin
## Model 2: mpg ~ cylinders + displacement + horsepower + weight + acceleration +
##     year + origin
##   Resid. Df Resid. Dev Df   Deviance Pr(>Chi)
## 1       384     5.3123
## 2       383     5.3114  1 0.00084304   0.8044
link=log일 때 autoModel5 선택
AIC(autoModel3)
## [1] 1989.276
AIC(autoModel5)
## [1] 1874.323
BIC(autoModel3)
## [1] 2021.046
BIC(autoModel5)
## [1] 1910.064
autoModel5가 autoModel3보다 AIC, BIC 모두 작게 나왔으므로 link=log 사용한 autoModel5선택한다.
\[log(E(mpg)) \ = \ 1.667 \ - \ 0.027(cylinders) \ + \ 0.001(displacement) \ - \ 0.001(horsepower) \ - \ 0.0002(weight) \ + \ 0.031(year) \ + \ 0.091(origin2) \ + \ 0.084(origin3)\]
Q-6
Q-6 4.9


Q-6 4.13


Q-6 4.16


Q-6 4.22

Q-6 4.25


