[의학통계방법론] Ch19. Simple Linear Correlation
Simple Linear Correlation
R 프로그램 결과
R 접기/펼치기 버튼
패키지 설치된 패키지 접기/펼치기 버튼
getwd()
## [1] "C:/Biostat"
library("foreign")
library("dplyr")
library("kableExtra")
library("GGally")
library("DescTools")
library("confintr")
library("diffcor")
library("remotes")
library("cower")
library("gtools")
library("psych")
library("ltm")
library("irr")
19장
19장 연습문제 불러오기
ex19_1a <- read.spss('Exam 19.1A.sav', to.data.frame=T)
ex19_12 <- read.spss('Exam 19.12.sav', to.data.frame=T)
ex19_13 <- read.spss('Exam 19.13.sav', to.data.frame=T)
ex19_14 <- read.spss('Exam 19.14.sav', to.data.frame=T)
ex19_15 <- read.spss('Exam 19.15.sav', to.data.frame=T)
ex19_16 <- read.spss('Exam 19.16.sav', to.data.frame=T)
ex19_17 <- read.spss('Exam 19.17.sav', to.data.frame=T)
ex19_18 <- read.spss('Exam 19.18.sav', to.data.frame=T)
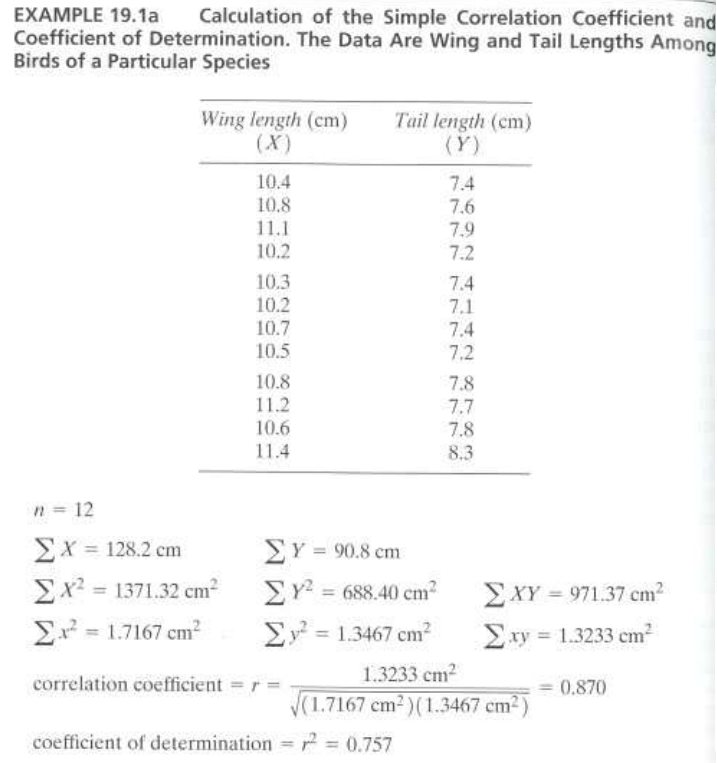
EXAMPLE 19.1a
#데이터셋
ex19_1a %>%
  kbl(caption = "Dataset",escape=F) %>%
  kable_styling(bootstrap_options = c("striped", "hover", "condensed", "responsive"))
| WingLeingth | TailLength |
|---|---|
| 10.4 | 7.4 |
| 10.8 | 7.6 |
| 11.1 | 7.9 |
| 10.2 | 7.2 |
| 10.3 | 7.4 |
| 10.2 | 7.1 |
| 10.7 | 7.4 |
| 10.5 | 7.2 |
| 10.8 | 7.8 |
| 11.2 | 7.7 |
| 10.6 | 7.8 |
| 11.4 | 8.3 |
- 해당 데이터는 새의 날개의 길이와 꼬리의 길이를 측정한 대한 데이터이다.
- 새의 날개의 길이와 꼬리의 길이에 대하여 상관계수와 결정계수를 구하여 보겠다.
wing<-ex19_1a$WingLeingth
tail<-ex19_1a$TailLength

n=nrow(ex19_1a)
sum_X=sum(wing)
sum_X2=sum(wing^2)
sum_x2=sum((wing-mean(wing))^2)

sum_Y=sum(tail)
sum_Y2=sum(tail^2)
sum_y2=sum((tail-mean(tail))^2)
sum_XY=sum(wing*tail)
sum_xy=sum((wing-mean(wing))*(tail-mean(tail)))
r=sum_xy/sqrt(sum_x2*sum_y2)
r2=r^2

cbind(n, sum_X, sum_X2, sum_x2, sum_Y, sum_Y2, sum_y2, sum_XY, sum_xy, r, r2) %>%
  kbl(caption = "Dataset",escape=F) %>%
  kable_styling(bootstrap_options = c("striped", "hover", "condensed", "responsive"))
| n | sum_X | sum_X2 | sum_x2 | sum_Y | sum_Y2 | sum_y2 | sum_XY | sum_xy | r | r2 |
|---|---|---|---|---|---|---|---|---|---|---|
| 12 | 128.2 | 1371.32 | 1.716667 | 90.8 | 688.4 | 1.346667 | 971.37 | 1.323333 | 0.8703546 | 0.7575171 |
- Pearson의 상관계수는 정규성 가정에서 출발하지 않았으며, 정규분포를 따르지 않더라도 1차 선형적인 연관성이 강하다면 구할 수 있다.
- 그래프를 그려서 선형성을 확인하여 보자.
plot(ex19_1a$WingLeingth,ex19_1a$TailLength,xlab = "Wing Length",ylab="Tail Length",main="Correlation",pch=19,col="#8dd3c7")
abline(lm(ex19_1a$TailLength ~ ex19_1a$WingLeingth), col = "#ffffb3", lwd = 4)
text(paste("Correlation:", round(r, 4)), x = 10.4, y = 8)

library("GGally")
ggpairs(ex19_1a, colums=1:2)

EXAMPLE 19.1b
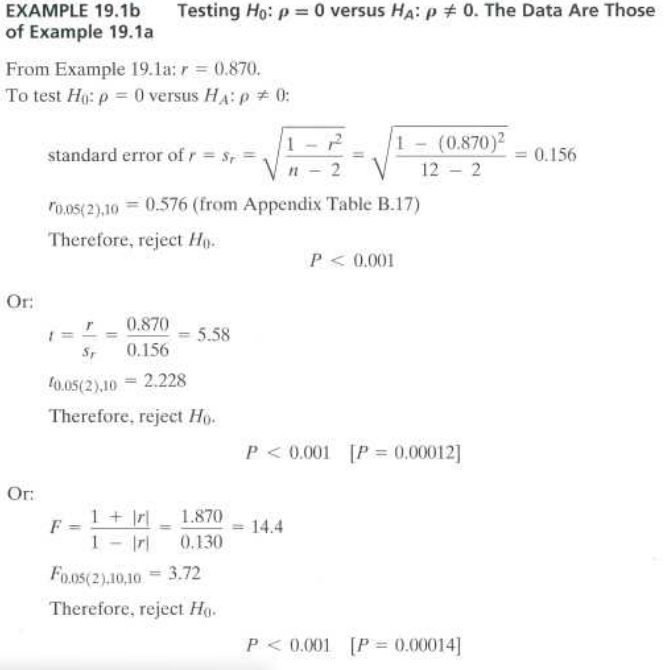
- 상관계수에 대한 검정의 가설은 다음과 같다.
- R에 내장된 함수 cor.test()를 사용하여 양측검정을 시행하여 보겠다.
cor.test(ex19_1a$WingLeingth, ex19_1a$TailLength, alternative='two.sided')
##
##  Pearson's product-moment correlation
##
## data:  ex19_1a$WingLeingth and ex19_1a$TailLength
## t = 5.5893, df = 10, p-value = 0.0002311
## alternative hypothesis: true correlation is not equal to 0
## 95 percent confidence interval:
##  0.5923111 0.9631599
## sample estimates:
##       cor
## 0.8703546
- 먼저 기본 옵션으로 제공되는 t-test에 대한 결과를 보면, t-값=5.5893이고, p-value=0.0002311로 유의수준 5%하에 대립가설을 채택한다.
- 따라서 상관계수는 0이 아니다라고 말할 수 있다.
- p-value=0.002311이 나왔는데 문제에서는 p-value=0.00012로 다른 것을 볼 수 있다.
- 예제에서는 표본상관계수가 이미 양수로 나왔기 때문에 우측만 보고 의사결정을 한 경우이다.
- 그렇다면 단측검정을 시행하여서 p-value가 같은지 확인하여 보겠다.
cor.test(ex19_1a$WingLeingth, ex19_1a$TailLength, alternative='greater')
##
##  Pearson's product-moment correlation
##
## data:  ex19_1a$WingLeingth and ex19_1a$TailLength
## t = 5.5893, df = 10, p-value = 0.0001156
## alternative hypothesis: true correlation is greater than 0
## 95 percent confidence interval:
##  0.6562825 1.0000000
## sample estimates:
##       cor
## 0.8703546
- p-value를 확인하여 보면 예제에서 나온 값이 같은 것을 볼 수 있다.
- R에서 나오는 기본 함수로는 t-test로 진행하지만 F통계량으로도 가설검정을 진행할 수 있다.
f<-(1+abs(r))/(1-abs(r))
f
## [1] 14.42669
- F 값은 14.4로써 3.72보다 크므로 귀무가설을 기각할 수 있다.
pf(f,10,10,lower.tail = F)
## [1] 0.000115553
- 단측가설의 대한 p-value=0.00012로써 유의수준 5%하에 귀무가설을 기각할 충분한 근거가 있으며,
- 예제에는 p-value는 양측에 대한 p-value가 구하여져 있기 때문에 좌측값 기준으로 계산된 p-value를 위에서 구한 p-value에 더해주면 양측에 대한 p-value가 구하여질 것이다.
EXAMPLE 19.2

- 이 예제에서는 상관계수가 0이 아닌 상수 0.750이 아닌지에 대한 검정을 하고자 한다.
- 상관계수가 0이외에 다른 특정 값인지에 대해서도 검정을 진행하는 경우 tan변환을 통해 통계량을 구하고 검정을 진행한다.
library("DescTools")
z<-FisherZ(r)
zeta<-FisherZ(0.75)
cat("z=",round(z,3),"zeta=",round(zeta,3))
## z= 1.335 zeta= 0.973
- Fisherz 함수를 이용하여 상관계수와 검정할 0.75를 변환시켰으며, 이 두 값으로 통계량 Z값을 구하여 보자.
Z<-(z-zeta)/sqrt(1/(n-3)); Z
## [1] 1.084755
pnorm(Z,lower.tail = F)*2
## [1] 0.2780303
- Z=1.08이고 이를 이용해 p-value를 구하면 0.28이다.
- 따라서 유의수준 0.05 하에서 귀무가설을 기각할 수 없고 모상관계수가 0.75가 아니라고 할만한 충분한 근거가 없다.
EXAMPLE 19.3
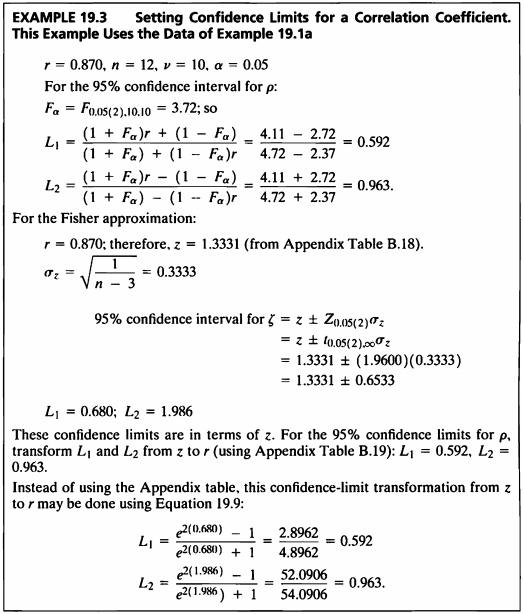
- 상관계수에 대해서도 신뢰한계를 구할 수 있다.
직접만든 함수로 구하여 보자.
f<-3.72
L1=((1+f)*r+(1-f))/((1+f)+(1-f)*r)
L2= ((1+f)*r-(1-f))/((1+f)-(1-f)*r)
cat("Confidence Limits for a Correlation Coefficient:",round(c(L1,L2),3))
## Confidence Limits for a Correlation Coefficient: 0.59 0.963
cor.test()를 사용하여 구하여 보자.
CI<-cor.test(ex19_1a$WingLeingth, ex19_1a$TailLength, alternative="two.sided", method="pearson")
CI$conf.int
## [1] 0.5923111 0.9631599
## attr(,"conf.level")
## [1] 0.95
ci_cor()를 사용하여 구하여 보자.
library("confintr")
ci_cor(ex19_1a$WingLeingth, ex19_1a$TailLength, method = "pearson",type="normal")
##
##  Two-sided 95% normal confidence interval for the true Pearson
##  correlation coefficient
##
## Sample estimate: 0.8703546
## Confidence interval:
##      2.5%     97.5%
## 0.5923111 0.9631599
EXAMPLE 19.4
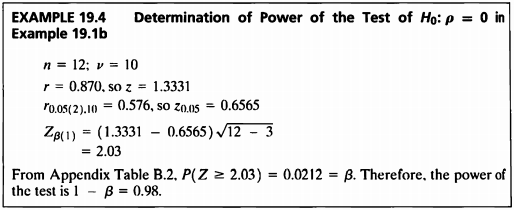
- 이 예제는 상관계수가 0인지를 검정할 때 그 가설을 기각하기 위한 power를 구하는 예제이다.
- pwr.r.test 패키지 함수를 이용하여 상관계수와 sample size, 유의수준, 양측검정인지 단측검정인지에 대해 입력하면 power를 계산할 수 있다.
library("pwr")
pw<-pwr.r.test(r, n=length(ex19_1a[,1]), sig.level = 0.05, alternative="two.sided")
cat("The power of the test is 1-β=",round(pw$power,2))
## The power of the test is 1-β= 0.98
EXAMPLE 19.5a
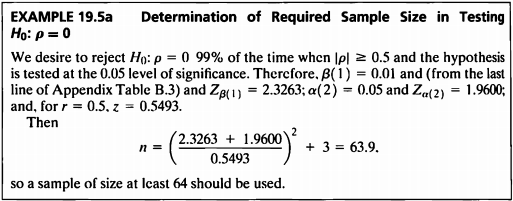
- 상관계수가 0인지를 검정할 때 그 가설을 기각하기 위한 sample size를 구하면 식은 다음과 같다.
- pwr.r.test 패키지 함수를 이용하여 상관계수와 power, 유의수준, 양측검정인지 단측검정인지에 대해 입력하면 귀무가설을 기각할 수 있는 최소한의 sample size를 계산할 수 있다.
ex19_5a<-pwr.r.test(r=0.5, power=0.99, sig.level = 0.05, alternative = "two.sided")
cat("n=",round(ex19_5a$n,1))
## n= 63.1
- 계산 결과 n=63.1이므로 귀무가설을 기각하기 위한 최소한의 sample size는 64이다.
EXAMPLE 19.5b
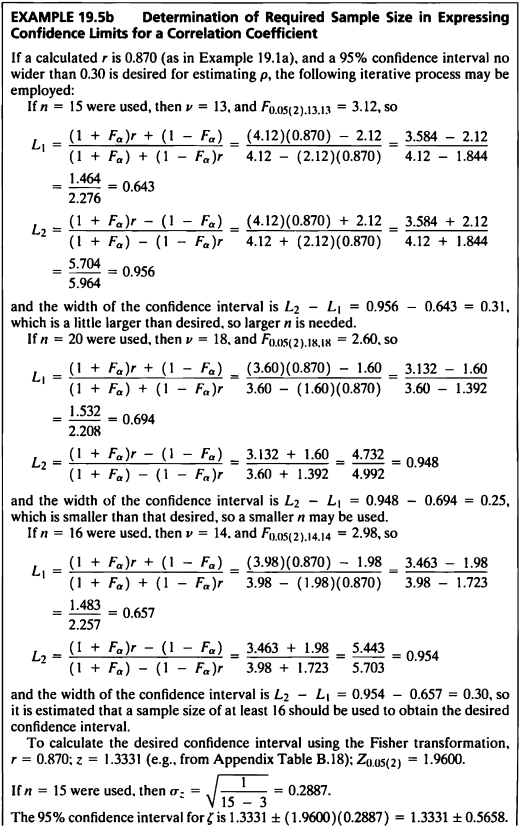
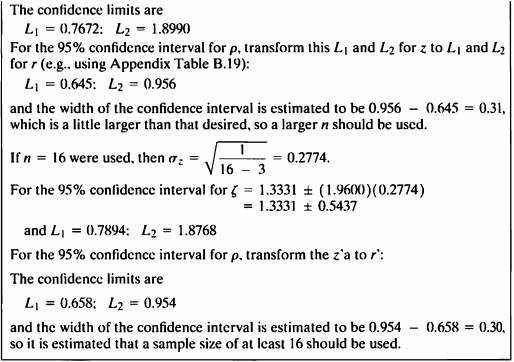
- pwr.r.test를 이용하는 방법 외에도 신뢰구간을 이용하여 귀무가설을 기각하기 위해 필요한 최소한의 sample size를 구할 수 있다.
- 예제 19.1a 에서 계산된 r이 0.87이고 모상관계수를 추정하기 위해 0.3보다 크지 않은 95% 신뢰구간이 필요한 경우 다음과 같은 프로세스를 사용할 수 있다.
#a)
e_195_b1<-function(n, alpha){
  v=n-2
  f_aa=round(qf(alpha/2, v, v, lower.tail = FALSE), 2)
  L1=round(((1+f_aa)*r+(1-f_aa))/((1+f_aa)+(1-f_aa)*r), 3)
  L2=round(((1+f_aa)*r-(1-f_aa))/((1+f_aa)-(1-f_aa)*r), 3)
  width_CI=L2-L1
  outcome=data.frame(f_aa, L1, L2, width_CI) %>% kbl(caption = "Ex 19.5 (b)") %>%
    kable_classic(full_width = F, html_font = "Cambria")

  return(outcome)
}
e_195_b1(15, 0.05)
| f_aa | L1 | L2 | width_CI |
|---|---|---|---|
| 3.12 | 0.644 | 0.957 | 0.313 |
- 먼저 필요한 sample size를 15라고 가정하고 신뢰구간을 구한 결과 신뢰구간의 길이는 0.312이었고, 이는 0.3보다 조금 큰 수치이므로 sample size를 늘려보자.
e_195_b1(20, 0.05)
| f_aa | L1 | L2 | width_CI |
|---|---|---|---|
| 2.6 | 0.695 | 0.948 | 0.253 |
- sample size를 20으로 가정하고 신뢰구간을 구한 결과 길이는 0.253이었고, 이는 0.3보다 작은 수치이므로 sample size를 줄여보자.
e_195_b1(16, 0.05)
| f_aa | L1 | L2 | width_CI |
|---|---|---|---|
| 2.98 | 0.658 | 0.955 | 0.297 |
- 이와 같이 계속해서 0.3에 가장 근사하는 sample size를 찾아나간 결과 귀무가설을 기각하기 위해 필요한 최소한의 sample size는 16이 나왔다.
- 다음은 r=0.87, z=1.3331로 고정된 경우 구하여 보자.
#b)
e_195_b2<-function(n, r, z){
  sigma_zz=sqrt(1/(n-3))
  z_crit=qnorm(0.025, lower.tail=FALSE)
  L1_F=z-z_crit*sigma_zz
  L2_F=z+z_crit*sigma_zz
  outcome=data.frame(z_crit, L1_F, L2_F) %>% kbl(caption = "Ex 19.5 (b)") %>%
    kable_classic(full_width = F, html_font = "Cambria")

  return(outcome)
}
e_195_b2(15, 0.870, 1.3331)
| z_crit | L1_F | L2_F |
|---|---|---|
| 1.959964 | 0.7673071 | 1.898893 |
- 먼저 필요한 sample size를 15라고 가정하고 신뢰구간을 구한 결과 신뢰구간은 (0.7672,1.8990)이었고, 이를 다시 변환하면 (0.645,0.956)의 값이 나왔다.
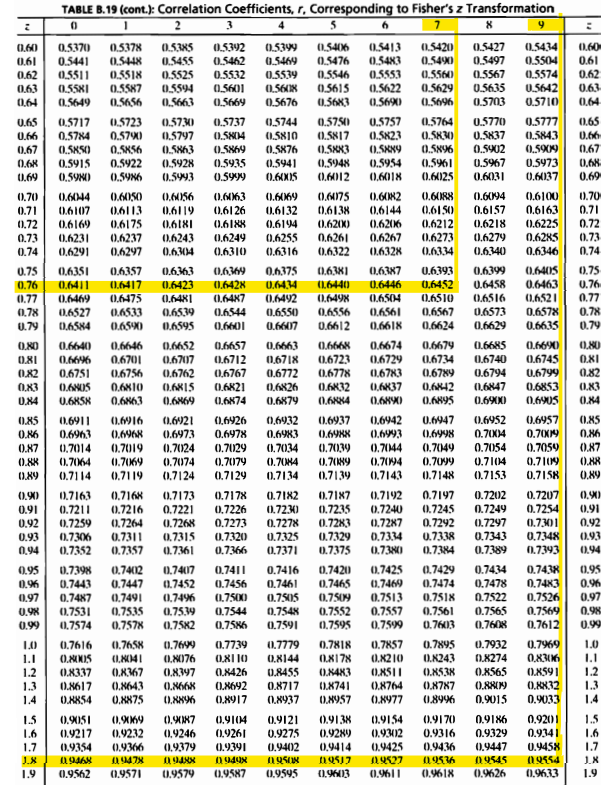
- 이 신뢰구간의 길이는 0.312이었고, 이는 0.3보다 조금 큰 수치이므로 sample size를 늘려보자.
e_195_b2(16, 0.870, 1.3331)
| z_crit | L1_F | L2_F |
|---|---|---|
| 1.959964 | 0.7895038 | 1.876696 |
- sample size를 16라고 가정하고 신뢰구간을 구한 결과 신뢰구간은 (0.7894,1.8768)이었고, 이를 다시 변환하면 (0.658,0.954)의 값이 나왔다.
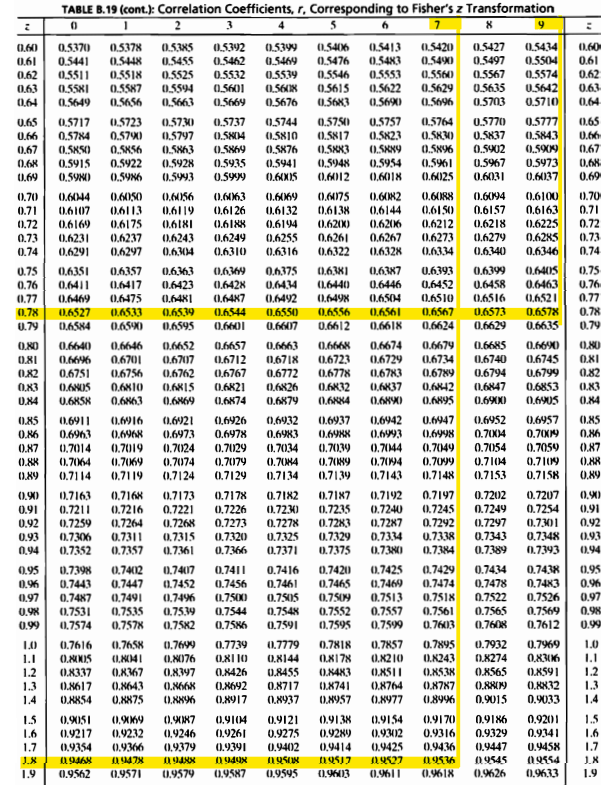
- 이 신뢰구간의 길이는 0.30이므로 sample size는 16으로 정한다.
EXAMPLE 19.6
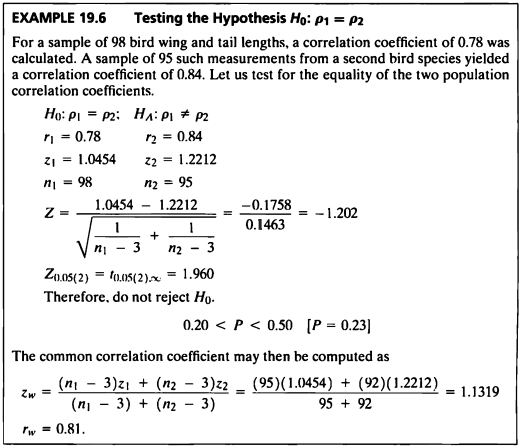
- 이 예제에서는 독립인 서로 다른 두 집단의 모상관계수가 같은지에 대해 검정해보겠다.
직접만든 함수로 구하여 보자.
r1= 0.78 ; r2=0.84
z1=1.0454 ; z2=1.2212
n1=98 ; n2=95
Z=(z1-z2)/sqrt((1/(n1-3))+(1/(n2-3)))
p<-round(pnorm(Z)*2,2)
cat("Z=",round(Z,3),"p-value=",round(p,2),"\nTherefore, do not reject H0.")
## Z= -1.202 p-value= 0.23
## Therefore, do not reject H0.
diffcor.two()를 사용하여 구하여 보자.
library("diffcor")
diffcor.two(0.78, 0.84, 98, 95, alpha = 0.05, cor.names = NULL,alternative = "two.sided")
##     r1   r2   LL1   UL1   LL2   UL2      z     p Cohen_q
## 1 0.78 0.84 0.688 0.847 0.769 0.891 -1.202 0.229  -0.176
- p-value는 모두 유의수준 0.05보다 크게 나타났고 귀무가설을 기각할 수 없다.
- 따라서 서로 다른 독립된 두 집단의 모상관계수가 다르다고 말할만한 충분한 근거가 없다.
- 귀무가설이 채택될 경우 공통상관계수를 구할 수 있으며 계산하면 공통상관계수는 0.81이다.
EXAMPLE 19.7
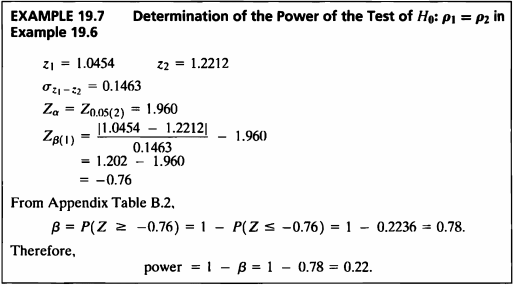
- 이 예제는 두 상관계수를 비교할 때의 검정력을 구하는 문제이다.
직접만든 함수로 구하여 보자.
z1=1.0454 ; z2=1.2212
sigma_12=0.1463
z_a=qnorm(0.025, lower.tail = FALSE)
z_b=round(((abs(z1-z2))/sigma_12)-z_a, 2)
beta=1-pnorm(z_b)
power.method2 = pnorm(z_b)
data.frame(power.method2) %>% kbl(caption = "Ex 19.7:방법1") %>%
  kable_classic(full_width = F, html_font = "Cambria")
| power.method2 |
|---|
| 0.2236273 |
power.indep.cor()를 사용하여 구하여 보자.
library("remotes")
# remotes::install_github('m-Py/cower')
# install_github("m-Py/cower")
library("cower")
e_197=power.indep.cor(r1=0.78, r2=0.84, n1=98, n2=95, sig.level = 0.05, alternative = "two.sided")
power.method1 = e_197$power
data.frame(power.method1) %>% kbl(caption = "Ex 19.7:방법2") %>%
    kable_classic(full_width = F, html_font = "Cambria")
| power.method1 |
|---|
| 0.2242004 |
- 검정통계량 값은 -0.76이고 이를 이용하여 정규분포표에서 값을 구하면 0.78이다. 따라서 검정력은 1-0.78=0.22가 된다.
EXAMPLE 19.8
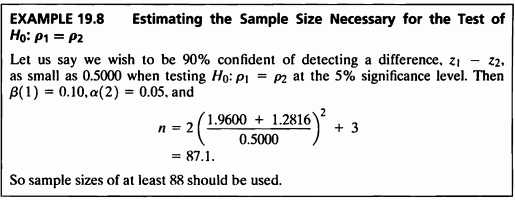
- 이 예제는 두 상관계수를 비교할 때의 sample size를 구하는 문제이다.
z_alpha= round(qnorm(0.05/2, lower.tail = F), 4)
z_beta=round(qnorm(0.10,lower.tail = F), 4)
n_198=2*(((z_alpha+z_beta)/(0.5000))^2)+3
sample.size = ceiling(n_198)
cbind(z_alpha, z_beta, n_198, sample.size) %>% kbl(caption = "Ex 19.8") %>%
  kable_classic(full_width = F, html_font = "Cambria")
| z_alpha | z_beta | n_198 | sample.size |
|---|---|---|---|
| 1.96 | 1.2816 | 87.06376 | 88 |
- 두 값들의 차이를 이용하여 sample size를 구했고, 그 결과 상관계수 간 0.5의 차이를 발견하기 위해 귀무가설을 기각하기 위한 최소의 필요한 sample size는 88이다.
EXAMPLE 19.9
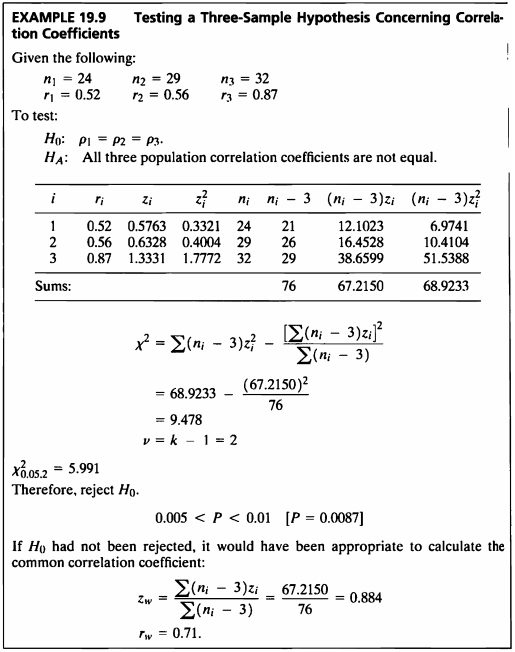
- 이 예제는 세 개의 상관계수를 비교하는 문제이다.
n=c(24,29,32)
r=c(0.52, 0.56, 0.87)

test.three_sample_corr <- function(n,r) {
  z = round(0.5*log((1+r)/(1-r)), 4)
  z_square = round(z^2, 4)
  n_minus_3 = n-3
  n_3_z = n_minus_3*z
  n_3_z_sqaure = n_minus_3*z_square
  test.stat = round(sum(n_3_z_sqaure) - (sum(n_3_z)^2)/sum(n_minus_3), 3)
  df = length(n)-1
  p.value = round(1 - pchisq(test.stat, df), 4)
  result.df = data.frame(test.stat, df, p.value)
  result.df<-result.df %>% kbl(caption = "Ex 19.9") %>%
    kable_classic(full_width = F, html_font = "Cambria")
  return(result.df)
}

test.three_sample_corr(n,r)
| test.stat | df | p.value |
|---|---|---|
| 9.478 | 2 | 0.0087 |
- 검정통계량 값은 9.478이고 p-value는 0.0087로 유의수준 하에서 귀무가설을 기각하게 된다.
- 따라서 적어도 하나 이상의 상관계수는 같지 않다고 할 수 있다.
- 귀무가설이 기각되지 않았다면, common correlation coefficient를 계산하는 것이 적절했을 것이다.
common.corr <- function(n,r) {
  z = round(0.5*log((1+r)/(1-r)), 4)
  z_square = round(z^2, 4)
  n_minus_3 = n-3
  n_3_z = n_minus_3*z
  n_3_z_sqaure = n_minus_3*z_square
  z.w = sum(n_3_z)/sum(n_minus_3)
  r.w = round((exp(2*z.w)-1) / (exp(2*z.w)+1), 4)
  r.w <- data.frame(r.w)
  r.w <- r.w %>% kbl(caption = "Ex 19.9") %>%
    kable_classic(full_width = F, html_font = "Cambria")

  return(r.w)
}
common.corr(n,r)
| r.w |
|---|
| 0.7086 |
- common correlation coefficient는 0.7086으로 계산되었다.
EXAMPLE 19.10
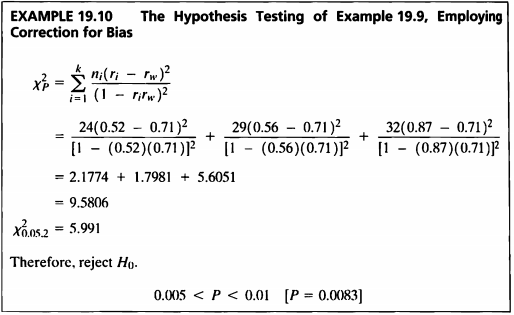
- 상관계수 변환 시 z-변환이 편향되는 점으로 편향 극복을 위해 수정된 검정통계량 값을 계산하여야 한다.
- Example 19.9와 동일한 가설을 correction for bias를 이용해 다시 구하여 보겠다.
n=c(24,29,32)
r=c(0.52, 0.56, 0.87)

test.corr_correction <- function(n,r) {
  z = round(0.5*log((1+r)/(1-r)), 4)
  z_square = round(z^2, 4)
  n_minus_3 = n-3
  n_3_z = n_minus_3*z
  n_3_z_sqaure = n_minus_3*z_square
  z.w = sum(n_3_z)/sum(n_minus_3)
  r.w = round((exp(2*z.w)-1) / (exp(2*z.w)+1), 2)

  test.stat = round(sum(n*t((r- r.w)^2) / (1 - r*r.w)^2), 4)
  df = length(n)-1
  p.value = round(1 - pchisq(test.stat, df), 4)
  result.df = data.frame(test.stat, p.value)
  result.df<-result.df %>% kbl(caption = "Ex 19.10") %>%
    kable_classic(full_width = F, html_font = "Cambria")
  return(result.df)
}

test.corr_correction(n,r)
| test.stat | p.value |
|---|---|
| 9.5805 | 0.0083 |
- 계산된 검정통계량은 9.5805, p-value는 0.0083으로 유의수준 0.05보다 작았다.
- 즉, 유의수준 5%하에 세 개의 모집단 상관 계수가 모두 같지 않다고 말할 충분한 증거가 있다.
- 이는 Example 19.9의 가설검정 결과와 동일하다.
EXAMPLE 19.11
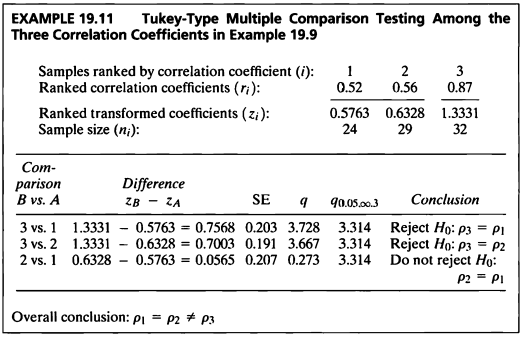
- 이 예제에서는 앞선 상관계수 검정을 통해 각 상관계수들이 모두 같지 않음을 확인했으므로 다중비교를 진행한다.
- Z-변환을 이용하여 Tukey의 다중비교를 진행하였다.
library("gtools")
z = round(0.5*log((1+r)/(1-r)), 4)
comb<-combinations(3, 2, v = 1:3)

comb <- data.frame(comb)
comb<-comb[order(comb$X2, decreasing = T),]

ex19.11_result = vector()
for (k in 1:3) {
  compar_vec = vector()
  i=comb[k,2]
  j=comb[k,1]

  compar=paste0(i," vs. ",j)
  compar_vec = c(compar_vec, "Comparison"=compar)

  diff= z[i]-z[j]
  compar_vec = c(compar_vec, "Difference"=diff)

  SE = round(sqrt(1/2*(1/(n[i]-3) + 1/(n[j]-3))), 3)
  compar_vec = c(compar_vec, "SE"=SE)

  q = round((z[i]-z[j]) / round(sqrt(1/2*(1/(n[i]-3) + 1/(n[j]-3))), 3), 3)
  compar_vec = c(compar_vec, "q"=q)
  compar_vec = c(compar_vec, "critical.value"=3.314)

  if (q > 3.314) {
    compar_vec = c(compar_vec, "Conclusion"="Reject H0")
  }
  else {
    compar_vec = c(compar_vec, "Conclusion"="Do not reject H0")
  }
  ex19.11_result<- rbind(ex19.11_result, compar_vec)
}

rownames(ex19.11_result) <- c(rep(" ", 3))

ex19.11_result %>% kbl(caption = "Ex 19.11") %>%
  kable_classic(full_width = F, html_font = "Cambria")
| Comparison | Difference | SE | q | critical.value | Conclusion | |
|---|---|---|---|---|---|---|
| 3 vs. 1 | 0.7568 | 0.203 | 3.728 | 3.314 | Reject H0 | |
| 3 vs. 2 | 0.7003 | 0.191 | 3.666 | 3.314 | Reject H0 | |
| 2 vs. 1 | 0.0565 | 0.207 | 0.273 | 3.314 | Do not reject H0 |
- 각각의 q 통계량을 3.314와 비교하면 그룹 3과 그룹1,2는 상관계수가 같다는 귀무가설을 기각했지만, 그룹 1과 그룹2는 귀무가설을 기각하지 못했다.
- 따라서 그룹 1과 그룹 2의 상관계수는 같으나 그룹 3의 상관계수는 다르다고 할 수 있다.
EXAMPLE 19.12
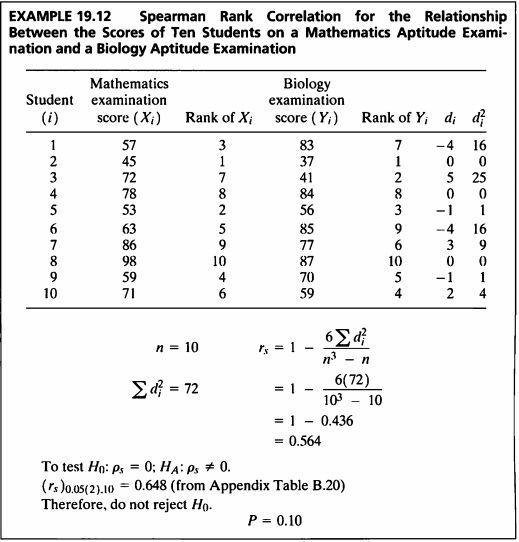
#데이터셋
ex19_12 %>%
  kbl(caption = "Dataset",escape=F) %>%
  kable_styling(bootstrap_options = c("striped", "hover", "condensed", "responsive"))
| Student | X | Y |
|---|---|---|
| 1 | 57 | 83 |
| 2 | 45 | 37 |
| 3 | 72 | 41 |
| 4 | 78 | 84 |
| 5 | 53 | 56 |
| 6 | 63 | 85 |
| 7 | 86 | 77 |
| 8 | 98 | 87 |
| 9 | 59 | 70 |
| 10 | 71 | 59 |
- n이 10 이상이고 순위상관계수가 0.9 이하이면 Fisher’s z-변환은 Spearman의 상관계수에도 사용될 수 있다.
ex19_12.result <-cor.test(ex19_12$X, ex19_12$Y, method="spearman")
ex19_12.result
##
##  Spearman's rank correlation rho
##
## data:  ex19_12$X and ex19_12$Y
## S = 72, p-value = 0.09579
## alternative hypothesis: true rho is not equal to 0
## sample estimates:
##       rho
## 0.5636364
ex19_12.result_table <- cbind("statistic"=ex19_12.result$statistic, "r"=round(ex19_12.result$estimate, 3),
      "p.value"=round(ex19_12.result$p.value, 3))
rownames(ex19_12.result_table)=c(" ")

ex19_12.result_table %>% kbl(caption = "Ex 19.12") %>%
    kable_classic(full_width = F, html_font = "Cambria")
| statistic | r | p.value | |
|---|---|---|---|
| 72 | 0.564 | 0.096 |
- 계산된 검정통계량 값은 0.564, p-value는 0.096으로 유의수준 0.05보다 크므로 귀무가설을 기각할 수 없다.
- 즉, 순위상관계수는 0이라고 말할 수 있으며, 수학시험 점수와 생물시험 점수 간 상관관계가 있다는 근거가 충분하지 않다고 말할 수 있다.
EXAMPLE 19.13
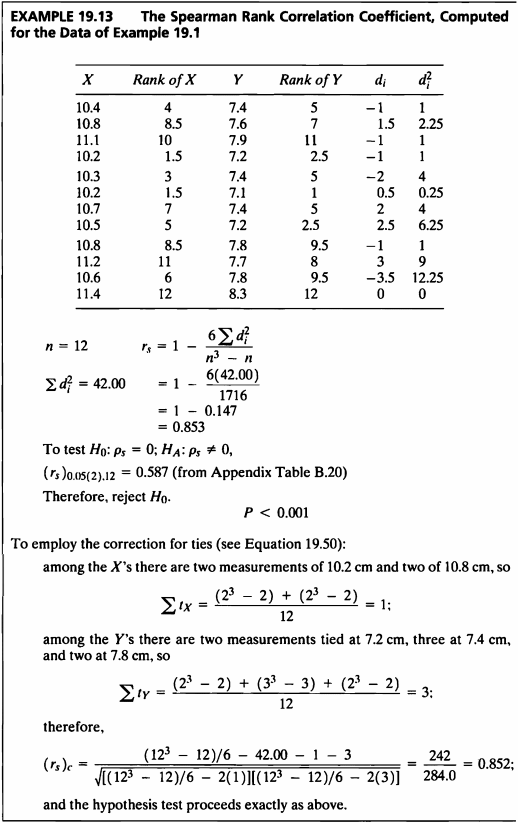
#데이터셋
ex19_13 %>%
  kbl(caption = "Dataset",escape=F) %>%
  kable_styling(bootstrap_options = c("striped", "hover", "condensed", "responsive"))
| Student | X | Y |
|---|---|---|
| 1 | 10.4 | 7.4 |
| 2 | 10.8 | 7.6 |
| 3 | 11.1 | 7.9 |
| 4 | 10.2 | 7.2 |
| 5 | 10.3 | 7.4 |
| 6 | 10.2 | 7.1 |
| 7 | 10.7 | 7.4 |
| 8 | 10.5 | 7.2 |
| 9 | 10.8 | 7.8 |
| 10 | 11.2 | 7.7 |
| 11 | 10.6 | 7.8 |
| 12 | 11.4 | 8.3 |
- 이 예제에서는 Example 19.1 데이터를 가지고 특정 종의 새에 대한 날개와 꼬리 사이에 순위 상관성이 존재하는지 확인하기 위해 검정할 것이다.
cor.test(ex19_13$X,ex19_13$Y,method = "spearman", exact = F)
##
##  Spearman's rank correlation rho
##
## data:  ex19_13$X and ex19_13$Y
## S = 42.59, p-value = 0.0004467
## alternative hypothesis: true rho is not equal to 0
## sample estimates:
##       rho
## 0.8510852
- 둘 사이에 순위 상관계수는 0.851이며 test 결과 p-value가 0.0004로 유의수준 0.05 보다 작기 때문에 귀무가설을 기각한다.
- 즉, 새의 날개와 꼬리 간에 순위 상관 관계가 존재한다고 할 수 있다.
EXAMPLE 19.14
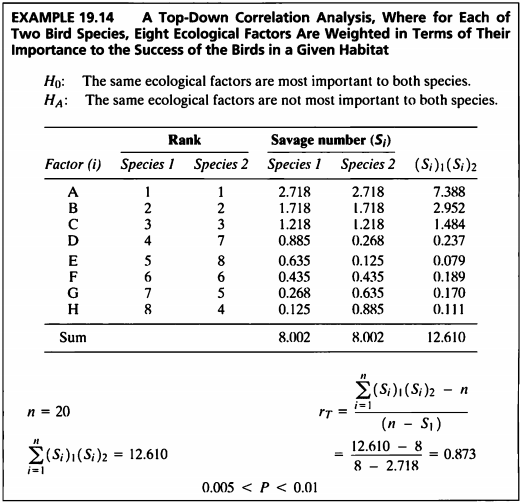
#데이터셋
ex19_14 %>%
  kbl(caption = "Dataset",escape=F) %>%
  kable_styling(bootstrap_options = c("striped", "hover", "condensed", "responsive"))
| Factor | Species1 | Species2 |
|---|---|---|
| A | 1 | 1 |
| B | 2 | 2 |
| C | 3 | 3 |
| D | 4 | 7 |
| E | 5 | 8 |
| F | 6 | 6 |
| G | 7 | 5 |
| H | 8 | 4 |
- 가중 순위 상관계수를 구하기 위해선 savage score을 사용한다.
j.inverse <- ex19_14$Species1^(-1)
savage.number1 = vector()
savage.number2 = vector()
for (k in 1:8) {
  S1 = round(sum(j.inverse[ex19_14$Species1[k]:8]), 3)
  savage.number1 = c(savage.number1, S1)

  S2 = round(sum(j.inverse[ex19_14$Species2[k]:8]), 3)
  savage.number2 = c(savage.number2, S2)
}

ex19_14.result <- cbind(ex19_14, savage.number1, savage.number2,
                        "(S1)(S2)"=round(savage.number1*savage.number2, 3))

ex19_14.result %>% kbl(caption = "Ex 19.14") %>%
    kable_classic(full_width = F, html_font = "Cambria")
| Factor | Species1 | Species2 | savage.number1 | savage.number2 | (S1)(S2) |
|---|---|---|---|---|---|
| A | 1 | 1 | 2.718 | 2.718 | 7.388 |
| B | 2 | 2 | 1.718 | 1.718 | 2.952 |
| C | 3 | 3 | 1.218 | 1.218 | 1.484 |
| D | 4 | 7 | 0.885 | 0.268 | 0.237 |
| E | 5 | 8 | 0.635 | 0.125 | 0.079 |
| F | 6 | 6 | 0.435 | 0.435 | 0.189 |
| G | 7 | 5 | 0.268 | 0.635 | 0.170 |
| H | 8 | 4 | 0.125 | 0.885 | 0.111 |
summation = sum(round(savage.number1*savage.number2, 3))
n = length(ex19_14$Factor)
r.T = round((summation-n) / (n-savage.number1[1]), 3)
cbind(n, r.T) %>% kbl(caption = "Ex 19.14") %>%
    kable_classic(full_width = F, html_font = "Cambria")
| n | r.T |
|---|---|
| 8 | 0.873 |
- Top down correlation 분석 결과, 상관계수는 0.873으로 계산되었다.
cor.test(savage.number1,savage.number2)
##
##  Pearson's product-moment correlation
##
## data:  savage.number1 and savage.number2
## t = 4.3616, df = 6, p-value = 0.004762
## alternative hypothesis: true correlation is not equal to 0
## 95 percent confidence interval:
##  0.4337146 0.9765680
## sample estimates:
##       cor
## 0.8719087
- 검정 결과 상관계수는 0.8719087이며 이에 대한 검정 결과 p-value=0.004762 이므로 0.05보다 작기 때문에 동일한 생태적 요인이 두 종 모두에게 가장 중요한 것은 아니라는 결론을 내릴 수 있다.
EXAMPLE 19.15
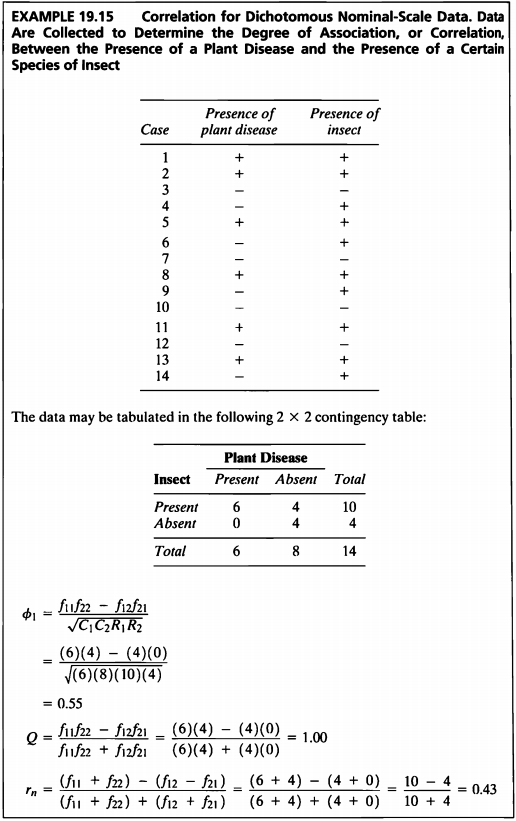
#데이터셋
ex19_15 %>%
  kbl(caption = "Dataset",escape=F) %>%
  kable_styling(bootstrap_options = c("striped", "hover", "condensed", "responsive"))
| Case | Disease | Insect |
|---|---|---|
| 1 | + | 1 |
| 2 | + | 1 |
| 3 | - | 0 |
| 4 | - | 1 |
| 5 | + | 1 |
| 6 | - | 1 |
| 7 | - | 0 |
| 8 | + | 1 |
| 9 | - | 1 |
| 10 | - | 0 |
| 11 | + | 1 |
| 12 | - | 0 |
| 13 | + | 1 |
| 14 | - | 1 |
- 해당 데이터는 두 개의 이항형 변수, 특정 곤충의 유무와 식물 유병의 유무에 대하여 기록한 데이터이다.
- phi 계수, Yule의 계수, 그리고 Ives and Gibbons의 계수로 상관관계를 알아보겠다.
library("psych")
cross.table<-table(ex19_15$Disease, ex19_15$Insect)

phi.coefficient <- phi(cross.table, digits = 2)
Yule.coefficient <- Yule(cross.table,Y=FALSE)
r.n = round(((cross.table[2,2] + cross.table[1,1]) - (cross.table[1,2] + cross.table[2,1])) /
  ((cross.table[2,2] + cross.table[1,1]) + (cross.table[1,2] + cross.table[2,1])), 2)

ex19_15.result <- cbind(phi.coefficient, Yule.coefficient, r.n)

ex19_15.result %>% kbl(caption = "Ex 19.15") %>%
    kable_classic(full_width = F, html_font = "Cambria")
| phi.coefficient | Yule.coefficient | r.n |
|---|---|---|
| 0.55 | 1 | 0.43 |
- phi의 계수의 경우 0.55, Yule의 계수의 경우 0.97 (almost 1), 그리고 Ives and Gibbons의 계수의 경우 약 0.43의 값을 가진다.
EXAMPLE 19.16
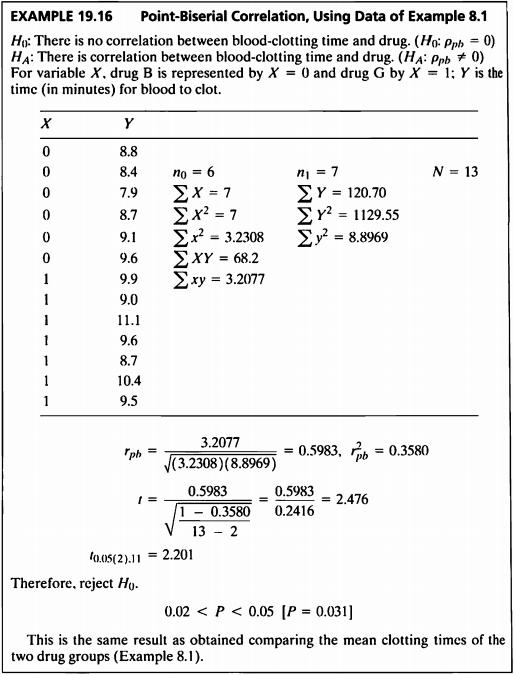
#데이터셋
ex19_16 %>%
  kbl(caption = "Dataset",escape=F) %>%
  kable_styling(bootstrap_options = c("striped", "hover", "condensed", "responsive"))
| X | Y |
|---|---|
| 0 | 8.8 |
| 0 | 8.4 |
| 0 | 7.9 |
| 0 | 8.7 |
| 0 | 9.1 |
| 0 | 9.6 |
| 1 | 9.9 |
| 1 | 9.0 |
| 1 | 11.1 |
| 1 | 9.6 |
| 1 | 8.7 |
| 1 | 10.4 |
| 1 | 9.5 |
- 예제 8.1은 변수 X가 약의 종류 2가지로 이항형이고, 변수 Y는 피가 응고되는 시간으로 연속형으로 하나의 변수가 이항형인 데이터이다.
- Example 8.1 데이터를 사용하여 피가 응고되는 시간과 약의 종류 간의 상관성을 알아보도록 하겠다.
library("ltm")
r.pb = round(biserial.cor(ex19_16$Y,ex19_16$X,level=2), 4)
r.pb_square = round(r.pb^2, 4)

ex19_16.result <- cor.test(ex19_16$Y,ex19_16$X)
ex19_16.result
##
##  Pearson's product-moment correlation
##
## data:  ex19_16$Y and ex19_16$X
## t = 2.4765, df = 11, p-value = 0.03076
## alternative hypothesis: true correlation is not equal to 0
## 95 percent confidence interval:
##  0.07058429 0.86434926
## sample estimates:
##       cor
## 0.5983011
ex19_16.resultdf <- cbind(r.pb, r.pb_square,
                          "statistic"=round(ex19_16.result$statistic, 3),
                          "p.value"=round(ex19_16.result$p.value, 3)
                          )
rownames(ex19_16.resultdf) = c(" ")
ex19_16.resultdf %>% kbl(caption = "Ex 19.16") %>%
    kable_classic(full_width = F, html_font = "Cambria")
| r.pb | r.pb_square | statistic | p.value | |
|---|---|---|---|---|
| 0.5983 | 0.358 | 2.476 | 0.031 |
- 계산된 Point-Biserial 상관계수는 0.5983이다.
- 그리고 검정통계량은 2.476이며, p-value는 0.031으로 유의수준 5%하에 귀무가설을 기각한다.
- 즉, 혈액 응고 시간과 약물 사이에는 상관관계가 존재한다는 충분한 증거가 있다.
EXAMPLE 19.17
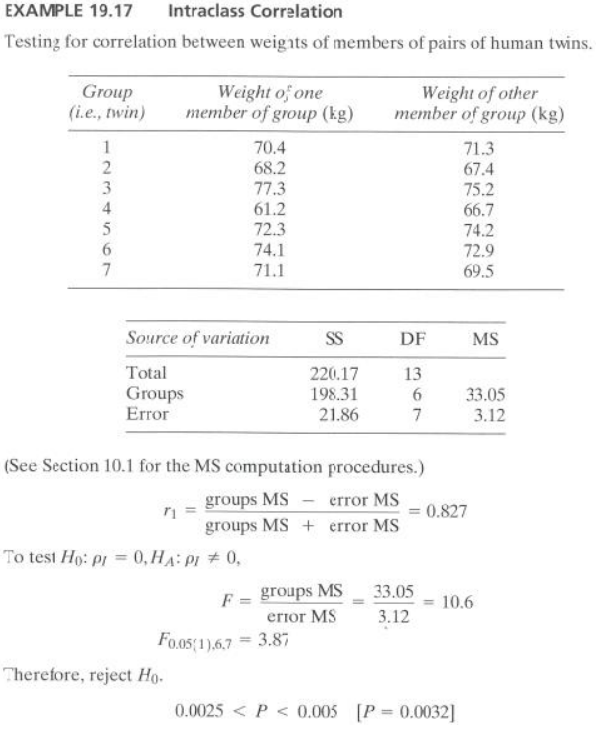
#데이터셋
ex19_17 %>%
  kbl(caption = "Dataset",escape=F) %>%
  kable_styling(bootstrap_options = c("striped", "hover", "condensed", "responsive"))
| Group | One | Other |
|---|---|---|
| 1 | 70.4 | 71.3 |
| 2 | 68.2 | 67.4 |
| 3 | 77.3 | 75.2 |
| 4 | 61.2 | 66.7 |
| 5 | 72.3 | 74.2 |
| 6 | 74.1 | 72.9 |
| 7 | 71.1 | 69.5 |
- 해당 데이터는 쌍둥이들의 체중에 대해 기록한 데이터이다.
- 쌍둥이들의 체중 사이에 급내 상관계수에 대해 알아보고자 한다.
- 급내상관계수 과정에 대한 가정으로 이변량 정규 분포로 부터 랜덤하게 추출되어야 하며, 모집단의 분산이 동일해야 한다.
정규성 검정
shapiro.test(ex19_17$One)
##
##  Shapiro-Wilk normality test
##
## data:  ex19_17$One
## W = 0.94626, p-value = 0.6956
shapiro.test(ex19_17$Other)
##
##  Shapiro-Wilk normality test
##
## data:  ex19_17$Other
## W = 0.94088, p-value = 0.6466
- 정규성 검정결과, p-value가 각 그룹에서 0.6956, 0.6466으로, 두 그룹모두 정규성 가정을 만족하였다.
등분산성 검정
bartlett.test(ex19_17[,2:3])
##
##  Bartlett test of homogeneity of variances
##
## data:  ex19_17[, 2:3]
## Bartlett's K-squared = 0.99636, df = 1, p-value = 0.3182
- 분산 검정결과 p-value가 0.3182으로 유의수준 0.05보다 컸다. 그러므로 등분산 가정도 만족하였다.
library("irr")
ex19_17.result <- icc(ex19_17[,2:3], unit="single",r0=0)
ex19_17.resultdf<-cbind("r1"=round(ex19_17.result$value, 3),
                        "F.value"=round(ex19_17.result$Fvalue, 1),
                        "p.value"=round(ex19_17.result$p.value, 4))
ex19_17.resultdf %>% kbl(caption = "Ex 19.17") %>%
    kable_classic(full_width = F, html_font = "Cambria")
| r1 | F.value | p.value |
|---|---|---|
| 0.827 | 10.6 | 0.0033 |
- 일곱 쌍둥이 간 체중의 급내 상관관수는 0.827이며,
- 급내 상관관계를 확인하기 위한 검정 결과 F값=10.6, p-value= 0.00325로 유의수준 5%하에 귀무가설을 기각한다.
- 즉, 일곱 쌍둥이 간 체중에 대해 급내 상관관계가 있다고 할 수 있다.
EXAMPLE 19.18
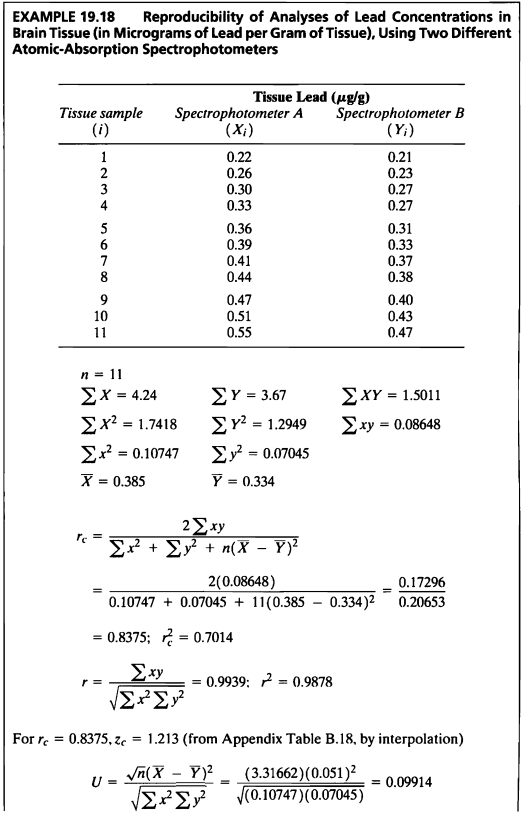
#데이터셋
ex19_18 %>%
  kbl(caption = "Dataset",escape=F) %>%
  kable_styling(bootstrap_options = c("striped", "hover", "condensed", "responsive"))
| Group | A | B |
|---|---|---|
| 1 | 0.22 | 0.21 |
| 2 | 0.26 | 0.23 |
| 3 | 0.30 | 0.27 |
| 4 | 0.33 | 0.27 |
| 5 | 0.36 | 0.31 |
| 6 | 0.39 | 0.33 |
| 7 | 0.41 | 0.37 |
| 8 | 0.44 | 0.38 |
| 9 | 0.47 | 0.40 |
| 10 | 0.51 | 0.43 |
| 11 | 0.55 | 0.47 |
- 해당 데이터는 두 개의 다른 원자 흡수 분광 광도계를 사용하여 뇌 조직의 납 농도 분석한 데이터이다.
- 이 예제의 데이터를 사용하여 일치 상관계수를 구해보도록 한다.
- 일치 상관계수는 데이턴의 일치도 혹은 재현성을 평가하기 위한 지표이다.
n<-length(ex19_18$A)
mean.A <- round(mean(ex19_18$A),3)
mean.B <- round(mean(ex19_18$B),3)
sum.A <- sum(ex19_18$A)
sum.B <- sum(ex19_18$B)
sum.AB <- sum(ex19_18$A*ex19_18$B)
sum.A2 <- sum(ex19_18$A^2)
sum.B2 <- sum(ex19_18$B^2)

ssA <- round(sum((ex19_18$A-mean.A)^2),5)
ssB <- round(sum((ex19_18$B-mean.B)^2),5)
ssAB <- sum((ex19_18$A-mean.A)*(ex19_18$B-mean.B))
r.c <- (2*ssAB) / (ssA+ssB+n*(mean.A-mean.B)^2)
r2.c <- r.c^2
r0 = ssAB / sqrt(ssA*ssB)
r02 = r0^2
U = (sqrt(n)*((mean.A-mean.B)^2)) / sqrt(ssA*ssB)

cbind(r.c, r2.c, r0, U) %>% kbl(caption ="Ex 19.18") %>%
  kable_classic(full_width = F, html_font = "Cambria")
| r.c | r2.c | r0 | U |
|---|---|---|---|
| 0.8373719 | 0.7011917 | 0.9937578 | 0.0991292 |
CCC(ex19_18$A, ex19_18$B, ci="z-transform", conf.level = 0.95)
## $rho.c
##         est    lwr.ci    upr.ci
## 1 0.8337058 0.6470369 0.9260831
##
## $s.shift
## [1] 0.809665
##
## $l.shift
## [1] -0.5826083
##
## $C.b
## [1] 0.8388642
##
## $blalt
##     mean delta
## 1  0.215  0.01
## 2  0.245  0.03
## 3  0.285  0.03
## 4  0.300  0.06
## 5  0.335  0.05
## 6  0.360  0.06
## 7  0.390  0.04
## 8  0.410  0.06
## 9  0.435  0.07
## 10 0.470  0.08
## 11 0.510  0.08
- 일치 상관계수는 데이터의 일치도 또는 재현성을 평가하기 위한 계수로 -1에서 1사이의 값을 가지고 절대값이 Pearson 상관계수보다 클 수 없으며, Pearson 상관계수가 0일 경우 일치 상관계수 또한 0이 나온다.
- 변수 A와 B에 대한 상관계수는 0.99로 0이 아님을 확인할 수 있고, 둘의 일치 상관계수는 0.8337이다.
SAS 프로그램 결과
SAS 접기/펼치기 버튼
19장
LIBNAME ex 'C:\Biostat';
RUN;

/*19장 연습문제 불러오기*/
PROC IMPORT DBMS=sav
DATAFILE='C:\Biostat\Exam 19.1A.sav'
OUT=ex.ex19_1a REPLACE;
RUN;

%macro chap19(name=,no=);
%do i=12 %to &no.;
	PROC IMPORT DBMS=sav
		DATAFILE="C:\Biostat\Exam 19.&i."
		OUT=ex.&name.&i. REPLACE;
	RUN;
%end;
%mend;

%chap19(name=ex19_,no=18);
EXAMPLE 19.1
PROC CORR DATA=ex.ex19_1A PEARSON;
     VAR WingLeingth TailLength;
RUN;
CORR 프로시저
| 2 개의 변수: | WingLeingth TailLength |
|---|
| 단순 통계량 | |||||||
|---|---|---|---|---|---|---|---|
| 변수 | N | 평균 | 표준편차 | 합 | 최솟값 | 최댓값 | 레이블 |
| WingLeingth | 12 | 10.68333 | 0.39505 | 128.20000 | 10.20000 | 11.40000 | WingLeingth |
| TailLength | 12 | 7.56667 | 0.34989 | 90.80000 | 7.10000 | 8.30000 | TailLength |
| 피어슨 상관 계수, N = 12 H0: Rho=0 가정하에서 Prob > |r| | ||
|---|---|---|
| WingLeingth | TailLength | |
WingLeingth WingLeingth | 1.00000 | 0.87035 0.0002 |
TailLength TailLength | 0.87035 0.0002 | 1.00000 |
EXAMPLE 19.2
PROC IML;
	r= 0.870;
	n = 12;
	z = 0.5 * log((1 + r) / (1 - r));
	a = 0.5 * log((1 + 0.750) / (1 - 0.750));
	cz = round((z - a) / (sqrt(1 / (n - 3))), .0001);
	p = round((1 - probnorm(cz)) * 2, .01);
	PRINT cz p;
RUN;

ods graphics off;ods exclude all;ods noresults;
PROC CORR DATA=ex.ex19_1A nosimple fisher(rho0=0.750 biasadj=no);
    VAR WingLeingth TailLength;
    ODS OUTPUT FisherPearsonCorr=fisher;
RUN;
ods graphics on;ods exclude none;ods results;

PROC PRINT DATA=fisher;
RUN;
| cz | p |
|---|---|
| 1.0804 | 0.28 |
| OBS | Var | WithVar | NObs | Corr | ZVal | Lcl | Ucl | Rho0 | pValue |
|---|---|---|---|---|---|---|---|---|---|
| 1 | WingLeingth | TailLength | 12 | 0.87035 | 1.33454 | 0.592311 | 0.963160 | 0.75000 | 0.3259 |
EXAMPLE 19.3
proc iml;
	reset nolong;
	r=0.870;f=3.72;
	L1=((1+f)*r+(1-f))/((1+f)+(1-f)*r);
	L2=((1+f)*r-(1-f))/((1+f)-(1-f)*r);
	print L1 L2;
run;
| L1 | L2 |
|---|---|
| 0.5890551 | 0.96331 |
EXAMPLE 19.4
PROC POWER;
    ONECORR DIST=fisherz
    NULLCORR=0
    CORR=0.870
    NTOTAL=12
    POWER=.;
RUN;
The POWER Procedure
Fisher's z Test for Pearson Correlation
| Fixed Scenario Elements | |
|---|---|
| Distribution | Fisher's z transformation of r |
| Method | Normal approximation |
| Null Correlation | 0 |
| Correlation | 0.87 |
| Total Sample Size | 12 |
| Number of Sides | 2 |
| Nominal Alpha | 0.05 |
| Number of Variables Partialled Out | 0 |
| Computed Power | |
|---|---|
| Actual Alpha | Power |
| 0.0491 | 0.987 |
EXAMPLE 19.5a
PROC POWER;
    ONECORR DIST=fisherz
    NULLCORR=0
    CORR=0.5
    NTOTAL=.
    POWER=0.99;
RUN;
The POWER Procedure
Fisher's z Test for Pearson Correlation
| Fixed Scenario Elements | |
|---|---|
| Distribution | Fisher's z transformation of r |
| Method | Normal approximation |
| Null Correlation | 0 |
| Correlation | 0.5 |
| Nominal Power | 0.99 |
| Number of Sides | 2 |
| Nominal Alpha | 0.05 |
| Number of Variables Partialled Out | 0 |
| Computed N Total | ||
|---|---|---|
| Actual Alpha | Actual Power | N Total |
| 0.05 | 0.990 | 63 |
EXAMPLE 19.5b
PROC IML;
    RESET nolog;
	r=0.870;f=2.98;
	L1=((1+f)*r+(1-f))/((1+f)+(1-f)*r);
	L2=((1+f)*r-(1-f))/((1+f)-(1-f)*r);
	diff=L2-L1;
    PRINT L1 L2 diff;
RUN;
QUIT;
| L1 | L2 | diff |
|---|---|---|
| 0.6567733 | 0.9544068 | 0.2976335 |
EXAMPLE 19.6
PROC IML;
    RESET nolog;
	r1=0.78;r2=0.84;
	z1=1.0454;z2=1.2212;
	n1=98;n2=95;

	z=(z1-z2)/sqrt((1/(n1-3))+(1/(n2-3)));

	p_value=probnorm(z)*2;
	zw=((n1-3)*z1+(n2-3)*z2)/(n1-3+n2-3);
	rw=(exp(2*(zw))-1)/(exp(2*(zw))+1);
    PRINT z p_value zw rw;
RUN;
QUIT;
| z | p_value | zw | rw |
|---|---|---|---|
| -1.20186 | 0.2294179 | 1.1318898 | 0.8116651 |
EXAMPLE 19.7
PROC IML;
    RESET nolog;
	r1=0.78;r2=0.84;
	z1=1.0454;z2=1.2212;
	n1=98;n2=95;

	z_beta=(abs(z1-z2))/sqrt((1/(n1-3))+(1/(n2-3)))-1.96;
	beta=1-probnorm(z_beta);
	power=1-beta;
    PRINT beta power;
RUN;
QUIT;
| beta | power |
|---|---|
| 0.7758165 | 0.2241835 |
EXAMPLE 19.8
PROC IML;
    RESET nolog;
	z1=-probit(0.05/2);z2=-probit(0.10);
	diff=0.5;
	n=2*(((z1+z2)/diff)**2)+3;
    PRINT n;
RUN;
QUIT;
| n |
|---|
| 87.059384 |
EXAMPLE 19.9
PROC IML;
    RESET nolog;
	n={24,29,32};
	r={0.52,0.56,0.87};
    z=0.5*log((1+r)/(1-r));

	z2=z#z;
	n_z2=(n-3)#z2;
	n_z=(n-3)#z;
	chi=sum(n_z2)-(sum((n_z))**2/sum(n-3));
	p=1-probchi(chi,2);

	zw=(sum((n_z))/sum(n-3));
	rw=(exp(2*(zw))-1)/(exp(2*(zw))+1);
    PRINT chi p zw rw;
RUN;
QUIT;
| chi | p | zw | rw |
|---|---|---|---|
| 9.4764447 | 0.0087542 | 0.8844225 | 0.7086279 |
EXAMPLE 19.10
PROC IML;
	n1 = 24 ;   n2 = 29;    n3 = 32;
	r1 = 0.52; r2 = 0.56;  r3 = 0.87;

	rw = 0.71 ;

	xp1 = round((n1 * (r1 - rw) ** 2) / (1 - r1 * rw) ** 2, .0001) ;
	xp2 = round((n2 * (r2 - rw) ** 2) / (1 - r2 * rw) ** 2, .0001) ;
	xp3 = round((n3 * (r3 - rw) ** 2) / (1 - r3 * rw) ** 2, .0001) ;

	xp = xp1 + xp2 + xp3 ;
	p = round(1- probchi(xp, 2), .0001);

	PRINT xp1 xp2 xp3 p ;

RUN;
| xp1 | xp2 | xp3 | p |
|---|---|---|---|
| 2.1774 | 1.7981 | 5.6051 | 0.0083 |
EXAMPLE 19.11
PROC IML;
	%macro ex19_11(x1,x2);
	n={24,29,32};
	r={0.52,0.56,0.87};
	z=0.5*log((1+r)/(1-r));
	diff=round(z[&x1]-z[&x2],0.0001);
	se=round(sqrt((1/2)*((1/(n[&x1]-3))+(1/(n[&x2]-3)))),0.001) ;
	q=round(diff/se,0.001);
		if q>=3.314 then conclusion='Reject H0' ;
		else if q <3.314 then conclusion='Do not reject H0' ;
	PRINT diff se q conclusion;
%mend ;
%ex19_11 (3,1) ;
%ex19_11 (3,2) ;
%ex19_11 (2,1) ;
QUIT;
| diff | se | q | conclusion |
|---|---|---|---|
| 0.7567 | 0.203 | 3.728 | Reject H0 |
| diff | se | q | conclusion |
|---|---|---|---|
| 0.7002 | 0.191 | 3.666 | Reject H0 |
| diff | se | q | conclusion |
|---|---|---|---|
| 0.0565 | 0.207 | 0.273 | Do not reject H0 |
EXAMPLE 19.12
PROC CORR DATA= ex.ex19_12 spearman nosimple;
	VAR x y ;
RUN;
CORR 프로시저
| 2 개의 변수: | X Y |
|---|
| 스피어만 상관 계수, N = 10 H0: Rho=0 가정하에서 Prob > |r| | ||
|---|---|---|
| X | Y | |
X X | 1.00000 | 0.56364 0.0897 |
Y Y | 0.56364 0.0897 | 1.00000 |
EXAMPLE 19.13
PROC CORR DATA= ex.ex19_13 spearman nosimple;
	VAR x y ;
RUN;
CORR 프로시저
| 2 개의 변수: | X Y |
|---|
| 스피어만 상관 계수, N = 12 H0: Rho=0 가정하에서 Prob > |r| | ||
|---|---|---|
| X | Y | |
X X | 1.00000 | 0.85109 0.0004 |
Y Y | 0.85109 0.0004 | 1.00000 |
EXAMPLE 19.14
DATA ex19_14;
INPUT species1 species2 @@;
   CARDS;
2.718 2.718
1.718 1.718
1.218 1.218
0.885 0.268
0.635 0.125
0.435 0.435
0.268 0.635
0.125 0.885
;
RUN;

PROC CORR DATA= ex19_14 pearson nosimple;
	VAR species1 species2 ;
RUN;
CORR 프로시저
| 2 개의 변수: | species1 species2 |
|---|
| 피어슨 상관 계수, N = 8 H0: Rho=0 가정하에서 Prob > |r| | ||
|---|---|---|
| species1 | species2 | |
| species1 | 1.00000 | 0.87191 0.0048 |
| species2 | 0.87191 0.0048 | 1.00000 |
EXAMPLE 19.15
ods graphics off; ods exclude all; ods noresults;
PROC FREQ DATA = ex.ex19_15;
	TABLES Disease*Insect / norow nocol nopercent expected chisq out=table19_15;
	TEST gamma;
	ODS OUTPUT ChiSq=ChiSq Gamma=Gamma;
RUN;
ods graphics on; ods exclude none; ods results;

PROC PRINT DATA=ChiSq label;
    WHERE Statistic="파이 계수";
    VAR Statistic Value;
RUN;

PROC PRINT DATA=Gamma label;
    VAR Label1 cValue1;
RUN;

PROC IML;
    RESET nolog;
	f11=6; f12=4;
	f21=0; f22=4;

	r_n=round(((f11+f22)-(f12+f21))/((f11+f22)+(f12+f21)), 0.01);

	PRINT r_n;
RUN;
QUIT;
| OBS | 통계량 | 값 |
|---|---|---|
| 5 | 파이 계수 | 0.5477 |
| OBS | Label1 | cValue1 |
|---|---|---|
| 1 | 감마 | 1.0000 |
| 2 | ASE | 0.0000 |
| 3 | 95% 신뢰하한 | 1.0000 |
| 4 | 95% 신뢰상한 | 1.0000 |
| r_n |
|---|
| 0.43 |
EXAMPLE 19.16
%macro biserial(version, data= ,contin= ,binary= ,out=);

%if &version ne %then %put BISERIAL macro Version 2.2;

options nonotes;
* exclude observations with missing variables *;
data &out;
 set &data;
 where &contin>.;
 if &binary>.;
 run;

* compute the ranks for the continuous variable *;
proc rank data=&out out=&out ;
 var &contin;
 ranks r_contin;
 run;

* compute proportion of binary, std of contin, and n *;
proc means data=&out noprint;
 var &binary &contin;
 output out=_temp_(keep=p stdy n) mean=p std=stdx stdy n=n;
 run;

* sort by the binary variable *;
proc sort data=&out;
 by descending &binary;
 run;

* compute mean of contin and rank of contin var *;
proc means data=&out noprint;
 by notsorted &binary;
 var &contin r_contin;
 output out=&out mean=my r_contin;
 run;

* restructure the means computed in the step above *;
proc transpose data=&out out=&out(rename=(col1=my1 col2=my0));
 var r_contin my;
 run;

* combine the data needed to compute biserial correlation *;
data &out;
 set &out(drop= _name_ _label_);
 retain r1 r0 ;
 if _n_=1 then do;
  r1=my1;
  r0=my0;
 end;
 else do;
  set _temp_;
  output;
 end;
 run;

* compute point biserial correlation *;
proc corr data=&data  noprint outp=_temp_;
 var &binary &contin;
 run;


* extract the point biserial correlation from the matrix *;
data _temp_(keep=pntbisrl);
 set _temp_(rename=(&contin=pntbisrl));
 if _TYPE_='CORR' and &binary<>1 then output;

 run;

options notes;
* compute biserial and rank biserial *;
data &out;
 merge _temp_  &out;
 if pntbisrl=1 then delete;
 h=probit(1-p);
 u=exp(-h*h/2)/sqrt(2*arcos(-1));
 biserial=p*(1-p)*(my1-my0)/stdy/u;
 rnkbisrl=2*(r1-r0)/n;

 keep biserial pntbisrl rnkbisrl;
 label biserial='Biserial Corr'
       pntbisrl='Point Biserial Corr'
       rnkbisrl='Rank Biserial Corr';
 run;

%mend;

%biserial(data=ex.ex19_16, contin=Y, binary=X, out=out19_16);

PROC PRINT DATA=out19_16 label;
	VAR pntbisrl;
RUN;

PROC IML;
	RESET nolog;
	n=13;
	r_pb=0.59830;
	r2_pb=(r_pb)**2;
	t=round((r_pb/sqrt((1-r2_pb)/(n-2))), 0.001);
	p_value = round((1 - probt(t, n-2))*2, 0.001);
	PRINT t p_value;
RUN;
QUIT;
| OBS | Point Biserial Corr |
|---|---|
| 1 | 0.59830 |
| t | p_value |
|---|---|
| 2.476 | 0.031 |
EXAMPLE 19.17
PROC IML;
    RESET nolog;
	sst=220.17; ssb=198.31;sse=21.86;
	df_b=6;df_e=7;
	msb=ssb/df_b;
	mse=sse/df_e;

	r=((msb-mse)/(msb+mse));
	f=msb/mse;

	p=1-probf(f,df_b,df_e);

	PRINT r f p;
RUN;
QUIT;
| r | f | p |
|---|---|---|
| 0.8273449 | 10.583791 | 0.003251 |
EXAMPLE 19.18
PROC MEANS DATA=ex.ex19_18 noprint;
	VAR A B;
	OUTPUT OUT=dice_baselinemin min=var1 var2;
RUN;

proc means data=ex.ex19_18 noprint;
	VAR A B;
	OUTPUT OUT=dice_baselinemax max=var1 var2;
RUN;

DATA dice_baselineall;
	SET dice_baselinemin dice_baselinemax;
	DROP _type_ _freq_;
	IF _N_=1 THEN var1=floor(min(var1,var2));
	IF _N_=1 THEN var2=floor(min(var1,var2));
	IF _N_=2 THEN var1=ceil(max(var1,var2));
	IF _N_=2 THEN var2=ceil(max(var1,var2));
RUN;

DATA dice_baselineall;
	SET ex.ex19_18 dice_baselineall;
RUN;

PROC GPLOT UNIFORM DATA=dice_baselineall;
plot A*B var1*var2/overlay vaxis=axis1 haxis=axis2 nolegend frame;
axis1 label=(a=90 'Cortisol Every Hour') minor=none;
axis2 label=('Cortisol Every Two Hours') minor=none;
symbol1 value=star color=black interpol=none;
symbol2 value=none color=black interpol=join;
title "Concordance Correlation Coefficient";
RUN;


PROC IML;
*******************************************************************************
  *  Enter the appropriate SAS data set name in the use statement and enter the *
  *  appropriate variable names in the read statements.                         *
  *******************************************************************************;
use ex.ex19_18;
read all var {A} into var1;
read all var {B} into var2;
*******************************************************************************
*  The IML module, labeled concorr, starts next.                              *
*******************************************************************************;
start concorr;
nonmiss=loc(var1#var2^=.);
var1=var1[nonmiss];
var2=var2[nonmiss];
free nonmiss;
n=nrow(var1);
mu1=sum(var1)/n;
mu1=round(mu1,0.0001);
mu2=sum(var2)/n;
mu2=round(mu2,0.0001);
sigma11=ssq(var1-mu1)/(n-1);
sigma11=round(sigma11,0.0001);
sigma22=ssq(var2-mu2)/(n-1);
sigma22=round(sigma22,0.0001);
sigma12=sum((var1-mu1)#(var2-mu2))/(n-1);
sigma12=round(sigma12,0.0001);
lshift=(mu1-mu2)/((sigma11#sigma22)##0.25);
rho=sigma12/sqrt(sigma11#sigma22);
rho=round(rho,0.0001);
z=log((1+rho)/(1-rho))/2;
se_z=1/sqrt(n-3);
t=tinv(0.975,n-3);
z_low=z-(se_z#t);
z_upp=z+(se_z#t);
rho_low=(exp(2#z_low)-1)/(exp(2#z_low)+1);
rho_low=round(rho_low,0.0001);
rho_upp=(exp(2#z_upp)-1)/(exp(2#z_upp)+1);
rho_upp=round(rho_upp,0.0001);
crho=(2#sigma12)/((sigma11+sigma22)+((mu1-mu2)##2));
crho=round(crho,0.0001);
z=log((1+crho)/(1-crho))/2;
if sigma12^=0 then do;
   t1=((1-(rho##2))#(crho##2))/((1-(crho##2))#(rho##2));
   t2=(2#(crho##3)#(1-crho)#(lshift##2))/(rho#((1-(crho##2))##2));
   t3=((crho##4)#(lshift##4))/(2#(rho##2)#((1-(crho##2))##2));
   se_z=sqrt((t1+t2-t3)/(n-2));
end;
else se_z=sqrt(2#sigma11#sigma22)/((sigma11+sigma22+((mu1-mu2)##2))#(n-2));
t=tinv(0.975,n-2);
z_low=z-(se_z#t);
z_upp=z+(se_z#t);
crho_low=(exp(2#z_low)-1)/(exp(2#z_low)+1);
crho_low=round(crho_low,0.0001);
crho_upp=(exp(2#z_upp)-1)/(exp(2#z_upp)+1);
crho_upp=round(crho_upp,0.0001);
Results=n//mu1//mu2//sigma11//sigma22//sigma12//rho_low//rho//rho_upp//
        crho_low//crho//crho_upp;
r_name={'SampleSize' 'Mean_1' 'Mean_2' 'Variance_1' 'Variance_2' 'Covariance' 'Corr LowerCL'
       'Corr' 'Corr UpperCL' 'ConcCorr LowerCL' 'ConcCorr' 'ConcCorr UpperCL'};
print 'The Estimated Correlation and Concordance Correlation (and 95% Confidence Limits)';
print Results [rowname=r_name];
finish concorr;
*******************************************************************************
*  The IML module, labeled concorr, is finished.                              *
*******************************************************************************;
RUN concorr;
| The Estimated Correlation and Concordance Correlation (and 95% Confidence Limits) |
| Results | |
|---|---|
| SampleSize | 11 |
| Mean_1 | 0.3855 |
| Mean_2 | 0.3336 |
| Variance_1 | 0.0107 |
| Variance_2 | 0.007 |
| Covariance | 0.0086 |
| Corr LowerCL | 0.9682 |
| Corr | 0.9937 |
| Corr UpperCL | 0.9988 |
| ConcCorr LowerCL | 0.6248 |
| ConcCorr | 0.8434 |
| ConcCorr UpperCL | 0.9394 |
교재: Biostatistical Analysis (5th Edition) by Jerrold H. Zar
**이 글은 22학년도 1학기 의학통계방법론 과제 자료들을 정리한 글 입니다.**
