[의학통계방법론] Ch15. Nested (Hierarchical) Analysis of Variance
Nested (Hierarchical) Analysis of Variance
R 프로그램 결과
R 접기/펼치기 버튼
패키지 설치된 패키지 접기/펼치기 버튼
getwd()
## [1] "C:/Biostat"
library("foreign")
library("dplyr")
library("kableExtra")
15장
15장 연습문제 불러오기
ex15_1a <- read.spss('Exam 15_1a.sav', to.data.frame=T)
EXAMPLE 15.1a

#데이터셋
ex15_1a%>%
  kbl(caption = "Dataset",escape=F) %>%
  kable_styling(bootstrap_options = c("striped", "hover", "condensed", "responsive"))
| drug | source | subj | resp |
|---|---|---|---|
| 1 | 1 | 1 | 102 |
| 1 | 1 | 2 | 104 |
| 1 | 2 | 3 | 103 |
| 1 | 2 | 4 | 104 |
| 2 | 3 | 5 | 108 |
| 2 | 3 | 6 | 110 |
| 2 | 4 | 7 | 109 |
| 2 | 4 | 8 | 108 |
| 3 | 5 | 9 | 104 |
| 3 | 5 | 10 | 106 |
| 3 | 6 | 11 | 105 |
| 3 | 6 | 12 | 107 |
- 해당 데이터는 세 가지 약 중 한 가지를 12명의 여성 각각에게 투여한 후 측정된 혈중 콜레스테롤 농도에 대한 데이터이다.
drug <- as.factor(ex15_1a$drug)
source <- as.factor(ex15_1a$source)
- 분석을 위해 drug와 source를 factor로 변환해 주었다.
tapply(ex15_1a$resp,drug,sum)
##   1   2   3
## 413 435 422
tapply(ex15_1a$resp,drug,mean)
##      1      2      3
## 103.25 108.75 105.50
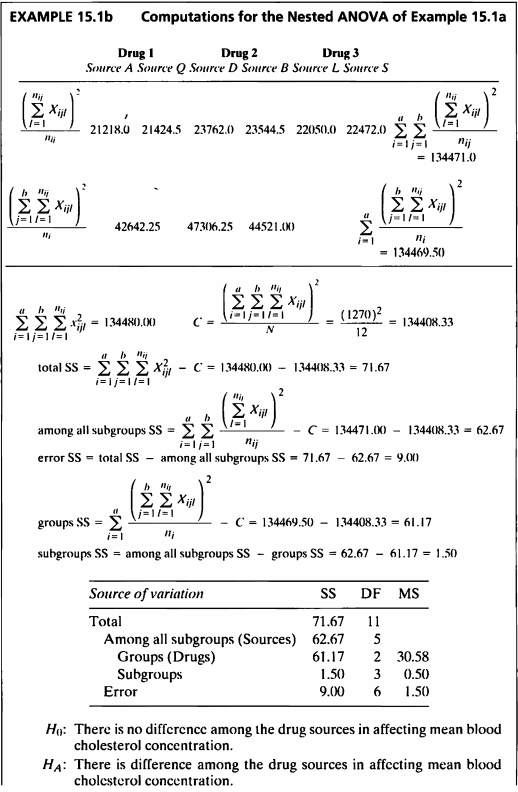
EXAMPLE 15.1b


- 콜레스테롤 수치는 drug type과 drug source에 영향을 받으므로, 두 인자를 고려하여 nested ANOVA를 수행하였다.
따라서 가설은 아래와 같이 두 가지다.
\[\begin{aligned} H_0 &: There \ is \ no \ difference \ among \ the \ drug \ sources \ in \ affecting \ mean \ blood \ cholesterol \ concentration. \\ H_A &: There \ is \ difference \ among \ the \ drug \ sources \ in \ affecting \ mean \ blood \ cholesterol \ concentration. \end{aligned}\]첫번째 가설
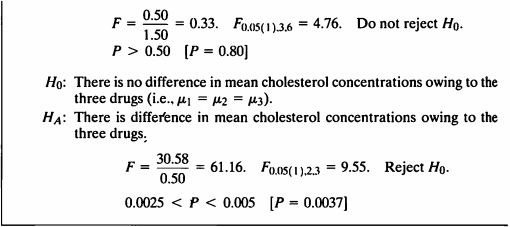
\[\begin{aligned} H_0 &: There \ is \ no \ difference \ in \ mean \ cholesterol \ concentrations \ owing \ to \ the \ three \ drugs. \\ H_A &: There \ is \ difference \ in \ mean \ cholesterol \ concentrations \ owing \ to \ the \ three \ drugs. \end{aligned}\]두번째 가설
fit <- lm(ex15_1a$resp~drug/source)
anova(fit)
## Analysis of Variance Table
##
## Response: ex15_1a$resp
##             Df Sum Sq Mean Sq F value  Pr(>F)
## drug         2 61.167  30.583 20.3889 0.00211 **
## drug:source  3  1.500   0.500  0.3333 0.80220
## Residuals    6  9.000   1.500
## ---
## Signif. codes:  0 '***' 0.001 '**' 0.01 '*' 0.05 '.' 0.1 ' ' 1
- 첫 번째 귀무가설에 대해, p-value=0.8022로 유의수준 5%하에 귀무가설을 기각하지 못하였다.
- 즉, 혈중 콜레스테롤 수치에 영향을 미치는 drug sources의 차이는 없다고 할 수 있는 근거가 충분하다 할 수 있다.
fit2 <- aov(ex15_1a$resp~drug+Error(source))
summary(fit2)
##
## Error: source
##           Df Sum Sq Mean Sq F value Pr(>F)
## drug       2  61.17   30.58   61.17 0.0037 **
## Residuals  3   1.50    0.50
## ---
## Signif. codes:  0 '***' 0.001 '**' 0.01 '*' 0.05 '.' 0.1 ' ' 1
##
## Error: Within
##           Df Sum Sq Mean Sq F value Pr(>F)
## Residuals  6      9     1.5
- 두 번째 귀무가설에 대해, p-value=0.0037로 유의수준 5%하에 귀무가설을 기각한다.
- 즉, 세가지 약으로 인한 콜레스테롤 수치 평균은 유의한 차이가 있다고 할 수 있는 근거가 충분하다.
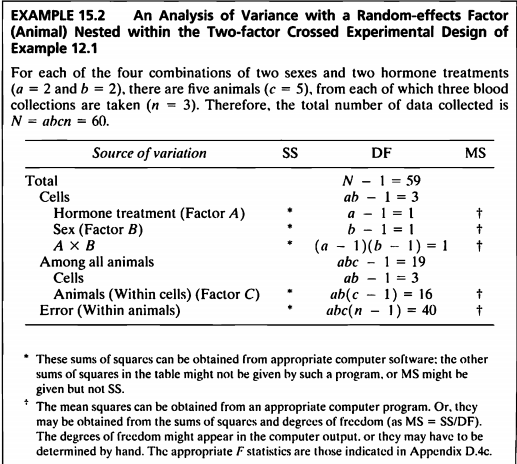
EXAMPLE 15.2


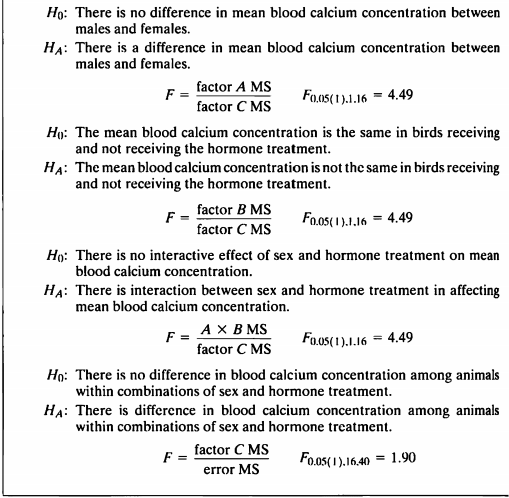
- 이 예제는 3개의 factor와 5번의 반복이 있는 삼요인설계 모형에서의 nested된 모형이다.
- 데이터의 뼈대는 12.1을 하고 있지만 반복 된 후의 데이터가 없어서 데이터를 새로 지정해주어야한다.
- 그래서 rnorm function으로 임의로 데이터를 지정해주었다.
- 데이터를 넣고 nested된 시간을 보고 가설 검정을 진행하여보겠겠다.
trt<-c(rep('NO',10), rep('YES',10))
gender<-c(rep('female',5),rep('male',5),rep('female',5), rep('male',5))
xx<-c(16.3,20.4,12.4,15.8,9.5,15.3,17.4,10.9,10.3,6.7, 38.1,26.2,32.3,35.8,30.2,34.0,22.8,27.8,25.0,29.3)
trt<-as.factor(trt) ; gender<-as.factor(gender)
ex1502=data.frame(trt,gender,xx)
a=ex1502[1:5,]; aa=a$xx; h0ft1=rnorm(5,mean(aa),1) ; h0ft2=rnorm(5,mean(aa),1)
b=ex1502[6:10,]; bb=b$xx; h0mt1=rnorm(5,mean(bb),1) ; h0mt2=rnorm(5,mean(bb),1)
c=ex1502[11:15,]; cc=c$xx; hxft1=rnorm(5,mean(cc),1) ; hxft2=rnorm(5,mean(cc),1)
d=ex1502[16:20,]; dd=d$xx; hxmt1=rnorm(5,mean(dd),1) ; hxmt2=rnorm(5,mean(dd),1)
new_xx<-c(aa,h0ft1,h0ft2,bb,h0mt1,h0mt2,cc,hxft1,hxft2,dd,hxmt1,hxmt2)
animal<-c(rep(c(1,2,3,4,5),12))
cell<-c(rep(1,15),rep(2,15),rep(3,15),rep(4,15))
new_trt<-c(rep('NO',30), rep('YES',30))
new_gender<-c(rep('female',15),rep('male',15),rep('female',15), rep('male',15))
ex1502a<-data.frame(new_trt,new_gender,cell,animal,new_xx)
new_gender<-as.factor(new_gender) ; new_trt<-as.factor(new_trt) ; cell<-as.factor(cell); animal <- as.factor(animal)
fit_animal<-lm(new_xx ~(new_gender*new_trt)/animal+(new_gender*new_trt)/cell)
anova(fit_animal)
## Analysis of Variance Table
##
## Response: new_xx
##                           Df Sum Sq Mean Sq  F value    Pr(>F)
## new_gender                 1  214.9   214.9  38.8940 2.198e-07 ***
## new_trt                    1 4153.8  4153.8 751.6521 < 2.2e-16 ***
## new_gender:new_trt         1    7.5     7.5   1.3496    0.2522
## new_gender:new_trt:animal 16  132.7     8.3   1.5008    0.1476
## Residuals                 40  221.1     5.5
## ---
## Signif. codes:  0 '***' 0.001 '**' 0.01 '*' 0.05 '.' 0.1 ' ' 1
SAS 프로그램 결과
SAS 접기/펼치기 버튼
15장
EXAMPLE 15.1
LIBNAME ex 'C:\Biostat';
RUN;

PROC IMPORT DBMS=sav
DATAFILE='C:\Biostat\Exam 15_1A.sav'
OUT=ex.ex15_1a REPLACE;
RUN;

title "Example 15.1";
ods graphics off;ods exclude all;ods noresults;
PROC GLM DATA=ex.ex15_1a;
	CLASS drug source;
	MODEL resp = drug source(drug) / solution;
	RANDOM source(drug) / test;
	ods output RandomModelANOVA = RandomModelANOVA OverallANOVA = OverallANOVA;
RUN;
ods graphics on;ods exclude none;ods results;

PROC PRINT DATA=OverallANOVA label;
RUN;
PROC PRINT DATA=RandomModelANOVA label;
    VAR Source error SS DF MS FValue ProbF;
RUN;
| OBS | Dependent | Source | DF | Sum of Squares | Mean Square | F Value | Pr > F |
|---|---|---|---|---|---|---|---|
| 1 | resp | Model | 5 | 62.66666667 | 12.53333333 | 8.36 | 0.0112 |
| 2 | resp | Error | 6 | 9.00000000 | 1.50000000 | _ | _ |
| 3 | resp | Corrected Total | 11 | 71.66666667 | _ | _ | _ |
| OBS | Source | Error | Type III SS | DF | Mean Square | F Value | Pr > F |
|---|---|---|---|---|---|---|---|
| 1 | drug | source(drug) | 61.166667 | 2 | 30.583333 | 61.17 | 0.0037 |
| 2 | Error | source(drug) | 1.500000 | 3 | 0.500000 | _ | _ |
| 3 | source(drug) | Error | 1.500000 | 3 | 0.500000 | 0.33 | 0.8022 |
| 4 | Error: MS(Error) | Error | 9.000000 | 6 | 1.500000 | _ | _ |
EXAMPLE 15.2
PROC IMPORT DATAFILE="C:\git_blog\study\data\의학통계방법론\ch15\ex1502a.csv" DBMS=csv OUT=ex.ex15_2a;
GETNAMES=Yes;
RUN;

PROC GLM DATA=ex.ex15_2a;
CLASS trt sex animal ;
    MODEL y = trt sex sex*trt animal(trt*sex) ;
    random animal(trt*sex) ;
    TEST H=trt E=animal(trt*sex);
    TEST H=sex E=animal(trt*sex);
    TEST H=sex*trt E=animal(trt*sex);
RUN;
The GLM Procedure
| Class Level Information | ||
|---|---|---|
| Class | Levels | Values |
| trt | 2 | NO YES |
| sex | 2 | female male |
| animal | 5 | 1 2 3 4 5 |
| Number of Observations Read | 60 |
|---|---|
| Number of Observations Used | 60 |
The GLM Procedure
Dependent Variable: y
| Source | DF | Sum of Squares | Mean Square | F Value | Pr > F |
|---|---|---|---|---|---|
| Model | 19 | 4532.722406 | 238.564337 | 46.53 | <.0001 |
| Error | 40 | 205.083610 | 5.127090 | ||
| Corrected Total | 59 | 4737.806016 |
| R-Square | Coeff Var | Root MSE | y Mean |
|---|---|---|---|
| 0.956713 | 10.35280 | 2.264308 | 21.87146 |
| Source | DF | Type I SS | Mean Square | F Value | Pr > F |
|---|---|---|---|---|---|
| trt | 1 | 4185.338364 | 4185.338364 | 816.32 | <.0001 |
| sex | 1 | 216.056461 | 216.056461 | 42.14 | <.0001 |
| trt*sex | 1 | 10.945035 | 10.945035 | 2.13 | 0.1518 |
| animal(trt*sex) | 16 | 120.382546 | 7.523909 | 1.47 | 0.1608 |
| Source | DF | Type III SS | Mean Square | F Value | Pr > F |
|---|---|---|---|---|---|
| trt | 1 | 4185.338364 | 4185.338364 | 816.32 | <.0001 |
| sex | 1 | 216.056461 | 216.056461 | 42.14 | <.0001 |
| trt*sex | 1 | 10.945035 | 10.945035 | 2.13 | 0.1518 |
| animal(trt*sex) | 16 | 120.382546 | 7.523909 | 1.47 | 0.1608 |
The GLM Procedure
| Source | Type III Expected Mean Square |
|---|---|
| trt | Var(Error) + 3 Var(animal(trt*sex)) + Q(trt,trt*sex) |
| sex | Var(Error) + 3 Var(animal(trt*sex)) + Q(sex,trt*sex) |
| trt*sex | Var(Error) + 3 Var(animal(trt*sex)) + Q(trt*sex) |
| animal(trt*sex) | Var(Error) + 3 Var(animal(trt*sex)) |
The GLM Procedure
Dependent Variable: y
| Tests of Hypotheses Using the Type III MS for animal(trt*sex) as an Error Term | |||||
|---|---|---|---|---|---|
| Source | DF | Type III SS | Mean Square | F Value | Pr > F |
| trt | 1 | 4185.338364 | 4185.338364 | 556.27 | <.0001 |
| sex | 1 | 216.056461 | 216.056461 | 28.72 | <.0001 |
| trt*sex | 1 | 10.945035 | 10.945035 | 1.45 | 0.2453 |
교재: Biostatistical Analysis (5th Edition) by Jerrold H. Zar
**이 글은 22학년도 1학기 의학통계방법론 과제 자료들을 정리한 글 입니다.**
