[의학통계방법론] Ch14. Multiway Factorial Analysis of Variance
Multiway Factorial Analysis of Variance
R 프로그램 결과
R 접기/펼치기 버튼
패키지 설치된 패키지 접기/펼치기 버튼
getwd()
## [1] "C:/Biostat"
library("foreign")
library("dplyr")
library("kableExtra")
library("broom")
14장
14장 연습문제 불러오기
ex14_1a <- read.spss('Exam 14.1A.sav', to.data.frame=T)
EXAMPLE 14.1


#데이터셋
ex14_1a%>%
  kbl(caption = "Dataset",escape=F) %>%
  kable_styling(bootstrap_options = c("striped", "hover", "condensed", "responsive"))
| Species | Sex | Temp | Y |
|---|---|---|---|
| 1 | 1 | 1 | 1.9 |
| 1 | 1 | 1 | 1.8 |
| 1 | 1 | 1 | 1.6 |
| 1 | 1 | 1 | 1.4 |
| 1 | 2 | 1 | 1.8 |
| 1 | 2 | 1 | 1.7 |
| 1 | 2 | 1 | 1.4 |
| 1 | 2 | 1 | 1.5 |
| 1 | 1 | 2 | 2.3 |
| 1 | 1 | 2 | 2.1 |
| 1 | 1 | 2 | 2.0 |
| 1 | 1 | 2 | 2.6 |
| 1 | 2 | 2 | 2.4 |
| 1 | 2 | 2 | 2.7 |
| 1 | 2 | 2 | 2.4 |
| 1 | 2 | 2 | 2.6 |
| 1 | 1 | 3 | 2.9 |
| 1 | 1 | 3 | 2.8 |
| 1 | 1 | 3 | 3.4 |
| 1 | 1 | 3 | 3.2 |
| 1 | 2 | 3 | 3.0 |
| 1 | 2 | 3 | 3.1 |
| 1 | 2 | 3 | 3.0 |
| 1 | 2 | 3 | 2.7 |
| 2 | 1 | 1 | 2.1 |
| 2 | 1 | 1 | 2.0 |
| 2 | 1 | 1 | 1.8 |
| 2 | 1 | 1 | 2.2 |
| 2 | 2 | 1 | 2.3 |
| 2 | 2 | 1 | 2.0 |
| 2 | 2 | 1 | 1.9 |
| 2 | 2 | 1 | 1.7 |
| 2 | 1 | 2 | 2.4 |
| 2 | 1 | 2 | 2.6 |
| 2 | 1 | 2 | 2.7 |
| 2 | 1 | 2 | 2.3 |
| 2 | 2 | 2 | 2.0 |
| 2 | 2 | 2 | 2.3 |
| 2 | 2 | 2 | 2.1 |
| 2 | 2 | 2 | 2.4 |
| 2 | 1 | 3 | 3.6 |
| 2 | 1 | 3 | 3.1 |
| 2 | 1 | 3 | 3.4 |
| 2 | 1 | 3 | 3.2 |
| 2 | 2 | 3 | 3.1 |
| 2 | 2 | 3 | 3.0 |
| 2 | 2 | 3 | 2.8 |
| 2 | 2 | 3 | 3.2 |
| 3 | 1 | 1 | 1.1 |
| 3 | 1 | 1 | 1.2 |
| 3 | 1 | 1 | 1.0 |
| 3 | 1 | 1 | 1.4 |
| 3 | 2 | 1 | 1.4 |
| 3 | 2 | 1 | 1.0 |
| 3 | 2 | 1 | 1.3 |
| 3 | 2 | 1 | 1.2 |
| 3 | 1 | 2 | 2.0 |
| 3 | 1 | 2 | 2.1 |
| 3 | 1 | 2 | 1.9 |
| 3 | 1 | 2 | 2.2 |
| 3 | 2 | 2 | 2.4 |
| 3 | 2 | 2 | 2.6 |
| 3 | 2 | 2 | 2.3 |
| 3 | 2 | 2 | 2.2 |
| 3 | 1 | 3 | 2.9 |
| 3 | 1 | 3 | 2.8 |
| 3 | 1 | 3 | 3.0 |
| 3 | 1 | 3 | 3.1 |
| 3 | 2 | 3 | 3.2 |
| 3 | 2 | 3 | 2.9 |
| 3 | 2 | 3 | 2.8 |
| 3 | 2 | 3 | 2.9 |
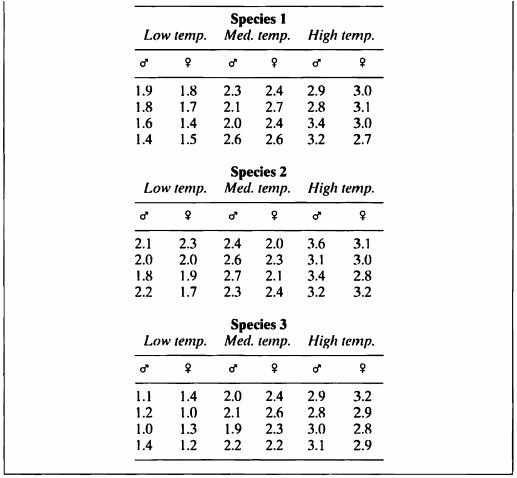
- 해당 데이터는 3 종류의 게의 데이터로 온도에 의한 산소 소비량을 기록한 데이터이다.
- 이 데이터를 사용하여 가능한 효과를 전부 포함한 완전모형에 대한 분산분석표를 작성하도록 한다.
species <- as.factor(ex14_1a$Species)
temperature <- as.factor(ex14_1a$Temp)
sex <- as.factor(ex14_1a$Sex)
oxygen <- ex14_1a$Y

anova(aov(oxygen ~ species*temperature*sex)) %>%
  tidy() %>%
  rename(" "="term","Sum Sq"="sumsq","Mean Sq"="meansq","F value"="statistic","Pr(>F)"="p.value") %>%
  kable(caption = "Three-factor ANOVA",booktabs = TRUE, valign = 't') %>%
  kable_styling(bootstrap_options = c("striped", "hover", "condensed", "responsive"))
| df | Sum Sq | Mean Sq | F value | Pr(\>F) | |
|---|---|---|---|---|---|
| species | 2 | 1.8175000 | 0.9087500 | 24.4750623 | 0.0000000 |
| temperature | 2 | 24.6558333 | 12.3279167 | 332.0236908 | 0.0000000 |
| sex | 1 | 0.0088889 | 0.0088889 | 0.2394015 | 0.6266204 |
| species:temperature | 4 | 1.1016667 | 0.2754167 | 7.4177057 | 0.0000775 |
| species:sex | 2 | 0.3702778 | 0.1851389 | 4.9862843 | 0.0102991 |
| temperature:sex | 2 | 0.1752778 | 0.0876389 | 2.3603491 | 0.1040564 |
| species:temperature:sex | 4 | 0.2205556 | 0.0551389 | 1.4850374 | 0.2195810 |
| Residuals | 54 | 2.0050000 | 0.0371296 | NA | NA |
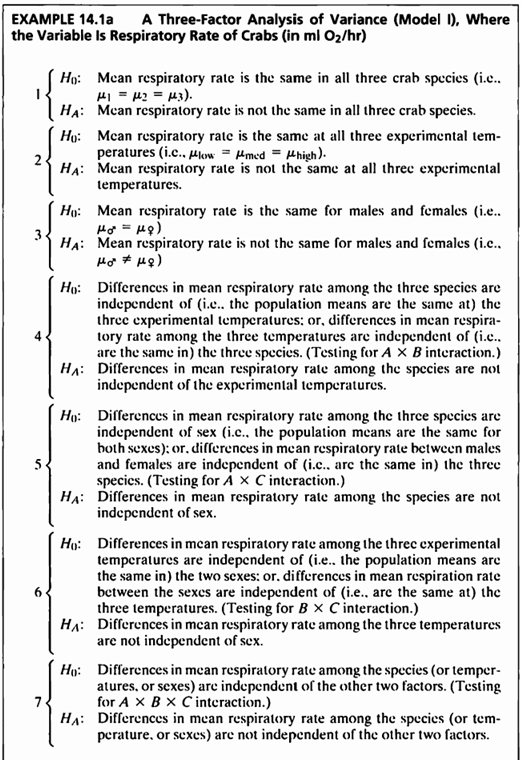
\[\begin{aligned} H_0 &: Mean \ respiratory \ rate \ is \ the \ same \ in \ all \ three \ crab \ species. \ (i.e., \ \mu_1=\mu_2=\mu_3) \\ H_A &: Mean \ respiratory \ rate \ is \ not \ the \ same \ in \ all \ three \ crab \ species. \end{aligned}\]첫번째 가설
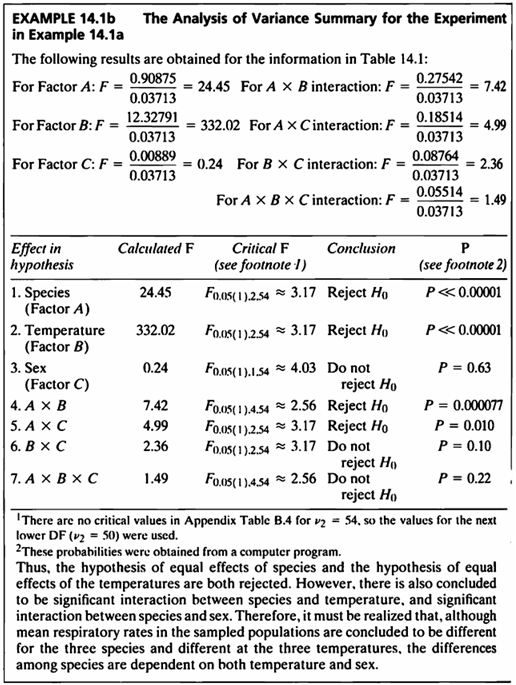
- Species에 대한 F값은 24.475이며, p-value<0.0001 이므로 유의수준 5%하에 게들의 종류들 간에 차이가 있다고 할 수 있다.
\[\begin{aligned} H_0 &: Mean \ respiratory \ rate \ is \ the \ same \ at \ all \ three \ experimental \ temperatures. \ (i.e., \ \mu_{low}=\mu_{med}=\mu_{high}) \\ H_A &: Mean \ respiratory \ rate \ is \ not \ the \ same \ at \ all \ three \ experimental \ temperatures. \end{aligned}\]두번째 가설
- Temperature에 대한 F값은 333.02이며, p-value<0.0001 이므로 유의수준 5%하에 온도 간 유의미한 차이가 있다고 할 수 있다.
\[\begin{aligned} H_0 &: Mean \ respiratory \ rate \ is \ the \ same \ for \ males \ and \ females. \ (i.e., \ \mu_{male}=\mu_{female}) \\ H_A &: Mean \ respiratory \ rate \ is \ not \ the \ same \ for \ males \ and \ females. \end{aligned}\]세번째 가설
- 성별에 대한 F값은 0.24이며, p-value=0.626 이므로 유의수준 5%하에 성별 간 유의미한 차이가 있다고 할 수 없다.
네번째 가설
- 종과 온도의 상호작용에 대한 F값은 7.418이며, p-value<0.0001 이므로 유의수준 5%하에 게의 종과 온도에 대한 상호작용 효과가 있다고 할 수 있다.
interaction.plot(temperature,species,oxygen,col=c("orange","#8f7450","#8dd3c7"),main="Interaction plot of temperature and species",lwd=2)

- 그래프를 보면 온도가 높고 2번째 종인 경우가 평균 산소 소비량이 제일 큰 조합임을 알 수 있다.
다섯번째 가설
- 종과 성별의 상호작용에 대한 F값은 4.99이며, p-value=0.01 이므로 유의수준 5%하에 게의 종과 성별에 대한 상호작용 효과가 있다고 할 수 있다.
interaction.plot(species,sex,oxygen,col=c("orange","#8f7450"),main="Interaction plot of species and sex",lwd=2)

- 그래프를 보면 성별이 남자고 2번째 종인 경우가 평균 산소 소비량이 제일 큰 조합임을 알 수 있다.
여섯번째 가설
- 온도와 성별의 상호작용에 대한 F값은 2.36이며, p-value=0.104 이므로 유의수준 5%하에 온도와 성별에 대한 상호작용 효과가 있다고 할 수 없다.
interaction.plot(temperature,sex,oxygen,col=c("orange","#8f7450"),main="Interaction plot of temperature and sex",lwd=2)

- 그래프를 보면 성별이 남자고 온도가 높은 경우가 평균 산소 소비량이 제일 큰 조합임을 알 수 있다.
일곱번째 가설
- 온도와 종과 성별 간의 상호작용에 대한 F값은 1.49이며, p-value=0.22로 유의수준 5%하에 온도와 종과 성별에 대한 상호작용 효과가 존재한다고 할 수 없다.
SAS 프로그램 결과
SAS 접기/펼치기 버튼
14장
EXAMPLE 14.1
LIBNAME ex 'C:\Biostat';
RUN;

PROC IMPORT OUT=ex.ex14_1a
    datafile='C:\Biostat\Exam 14.1A.sav' REPLACE
    DBMS=sav;
RUN;

ods graphics off;ods exclude all;ods noresults;
PROC GLM DATA=ex.ex14_1a;
	CLASS species sex temp ;
	MODEL y=species|temp|sex;
	LSMEANS species|temp|sex/adjust=tukey;
	ODS OUTPUT OverallANOVA =OverallANOVA ModelANOVA=ModelANOVA;
RUN;
QUIT;
ods graphics on;ods exclude none;ods results;

PROC PRINT DATA=OverallANOVA;
RUN;

PROC PRINT DATA=ModelANOVA;
RUN;
| OBS | Dependent | Source | DF | SS | MS | FValue | ProbF |
|---|---|---|---|---|---|---|---|
| 1 | Y | Model | 17 | 28.35000000 | 1.66764706 | 44.91 | <.0001 |
| 2 | Y | Error | 54 | 2.00500000 | 0.03712963 | _ | _ |
| 3 | Y | Corrected Total | 71 | 30.35500000 | _ | _ | _ |
| OBS | Dependent | HypothesisType | Source | DF | SS | MS | FValue | ProbF |
|---|---|---|---|---|---|---|---|---|
| 1 | Y | 1 | Species | 2 | 1.81750000 | 0.90875000 | 24.48 | <.0001 |
| 2 | Y | 1 | Temp | 2 | 24.65583333 | 12.32791667 | 332.02 | <.0001 |
| 3 | Y | 1 | Species*Temp | 4 | 1.10166667 | 0.27541667 | 7.42 | <.0001 |
| 4 | Y | 1 | Sex | 1 | 0.00888889 | 0.00888889 | 0.24 | 0.6266 |
| 5 | Y | 1 | Species*Sex | 2 | 0.37027778 | 0.18513889 | 4.99 | 0.0103 |
| 6 | Y | 1 | Sex*Temp | 2 | 0.17527778 | 0.08763889 | 2.36 | 0.1041 |
| 7 | Y | 1 | Species*Sex*Temp | 4 | 0.22055556 | 0.05513889 | 1.49 | 0.2196 |
| 8 | Y | 3 | Species | 2 | 1.81750000 | 0.90875000 | 24.48 | <.0001 |
| 9 | Y | 3 | Temp | 2 | 24.65583333 | 12.32791667 | 332.02 | <.0001 |
| 10 | Y | 3 | Species*Temp | 4 | 1.10166667 | 0.27541667 | 7.42 | <.0001 |
| 11 | Y | 3 | Sex | 1 | 0.00888889 | 0.00888889 | 0.24 | 0.6266 |
| 12 | Y | 3 | Species*Sex | 2 | 0.37027778 | 0.18513889 | 4.99 | 0.0103 |
| 13 | Y | 3 | Sex*Temp | 2 | 0.17527778 | 0.08763889 | 2.36 | 0.1041 |
| 14 | Y | 3 | Species*Sex*Temp | 4 | 0.22055556 | 0.05513889 | 1.49 | 0.2196 |
교재: Biostatistical Analysis (5th Edition) by Jerrold H. Zar
**이 글은 22학년도 1학기 의학통계방법론 과제 자료들을 정리한 글 입니다.**
