[의학통계방법론] Ch8. Two-Sample Hypotheses
Two-Sample Hypotheses
R 프로그램 결과
R 접기/펼치기 버튼
패키지 설치된 패키지 접기/펼치기 버튼
getwd()
## [1] "C:/Biostat"
library("readxl")
library("dplyr")
library("asht")
library("lawstat")
library("kableExtra")
library("qpcR")
library("RVAideMemoire")
library("vegan")
library("gmodels")
엑셀파일불러오기
#모든 시트를 하나의 리스트로 불러오는 함수
read_excel_allsheets <- function(file, tibble = FALSE) {
  sheets <- readxl::excel_sheets(file)
  x <- lapply(sheets, function(X) readxl::read_excel(file, sheet = X, na = "."))
  if(!tibble) x <- lapply(x, as.data.frame)
  names(x) <- sheets
  x
}
8장
8장 연습문제 불러오기
#data_chap08에 연습문제 8장 모든 문제 저장
data_chap08 <- read_excel_allsheets("data_chap08.xls")

#연습문제 각각 데이터 생성
for (x in 1:length(data_chap08)){
  assign(paste0('ex8_',c(1:2,'2a',7:8,10:11))[x],data_chap08[x])
  }

#연습문제 데이터 형식을 리스트에서 데이터프레임으로 변환
for (x in 1:length(data_chap08)){
  assign(paste0('ex8_',c(1:2,'2a',7:8,10:11))[x],data.frame(data_chap08[x]))
  }
EXAMPLE 8.1

#데이터셋
ex8_1%>%
  kbl(caption = "Dataset",escape=F) %>%
  kable_styling(bootstrap_options = c("striped", "hover", "condensed", "responsive"))
| exam8_1.drug | exam8_1.time |
|---|---|
| B | 8.8 |
| B | 8.4 |
| B | 7.9 |
| B | 8.7 |
| B | 9.1 |
| B | 9.6 |
| C | 9.9 |
| C | 9.0 |
| C | 11.1 |
| C | 9.6 |
| C | 8.7 |
| C | 10.4 |
| C | 9.5 |
- 약물 B를 투여했을 때 모든 성체 수컷 토끼의 혈액 응고 시간 평균이 약물 G를 투여했을 때 모든 성체 수컷 토끼의 혈액 응고 시간 평균이 다른지 검정하고자 한다.
- 성체 수컷 토끼 6마리에게 약물 B를 투여하였으며, 다른 성체 수컷 토끼 7마리에게 추출하여 두개의 표본은 독립적이게 추출하였다.
- 이표본 t-검정을 하기 전에 두 개의 표본분포의 정규성을 각각 보여야 하고 두 그룹 분포간 분산이 같은지 등분산성 가정을 확인해 줘야 한다.
- 정규성 검정은 P-P plot과 Q-Q plot으로도 정규성을 확인 할 수 있지만 그래프로 확인하는 정규성 검정은 기준이 모호하기 때문에 한계가 있다.
- 따라서 정규성에 대한 기타 평가 방법들을 사용할 것인데 표본의 크기가 작으므로 Shapiro-Wilk test를 사용할 것이다.
(표본크기가 매우 작으므로 웬만해선 정규성이 있는 것처럼 나올 것이다.)
##정규성,등분산성 검정
test <- function(x,y) {
  norm1 = shapiro.test(x)$p.value
  norm2 = shapiro.test(y)$p.value
  equal.var = var.test(x,y)$p.value
  summary <- list('그룹B 샤피로윌크 p-value'=norm1, '그룹G 샤피로윌크 p-value'=norm2, '그룹B,그룹G 등분산성검정 p-value'=equal.var)
  return(summary)
}

group_B <- ex8_1 %>% filter(exam8_1.drug=='B')
group_G <- ex8_1 %>% filter(exam8_1.drug=='C')
test(group_B$exam8_1.time,group_G$exam8_1.time)
## $`그룹B 샤피로윌크 p-value`
## [1] 0.9973428
##
## $`그룹G 샤피로윌크 p-value`
## [1] 0.9132339
##
## $`그룹B,그룹G 등분산성검정 p-value`
## [1] 0.4721646
- 정규성 검정은 shapiro.test를 통하여 구할 수 있다.
- p-value가 정해둔 유의수준 0.05보다 크다면 유의수준 5%하에 “분포가 정규성을 따른다”는 귀무가설을 기각할 수 없다.
- 즉, p-value가 각각 0.997, 0.913 이므로 유의수준 0.05보다 크므로 유의수준 5%하에 두 집단 모두 정규성을 따르지 않는다고 할 충분한 증거가 없다.
- 등분산성 검정은 var.test (F Test to Compare Two Variances Performs an F test to compare the variances of two samples from normal populations.) 로 확인할 수 있으며 p-value가 정해둔 유의수준 0.05보다 크다면 유의수준 5%하에 “두 집단의 분산은 등분산이다”라는 귀무가설을 기각할 수 없다.
- 따라서 p-value가 0.472로 유의수준 0.05보다 크므로 유의수준 5%하에 “두 집단의 모분산은 등분산이 아니다”라고 할 충분한 근거가 없다.
다음은 R 내장 함수로 구한 t-value이다.
t.test(group_B$exam8_1.time,group_G$exam8_1.time,var.equal = T)
##
##  Two Sample t-test
##
## data:  group_B$exam8_1.time and group_G$exam8_1.time
## t = -2.4765, df = 11, p-value = 0.03076
## alternative hypothesis: true difference in means is not equal to 0
## 95 percent confidence interval:
##  -1.8752609 -0.1104534
## sample estimates:
## mean of x mean of y
##  8.750000  9.742857
직접 함수를 작성해서 구하여 보자.
two_tailed_t_test <- function(x,y){
  n1 <- length(na.omit(x))
  n2 <- length(na.omit(y))
  v1 <- n1-1
  v2 <- n2-1
  xbar1 <- mean(x)
  xbar2 <- mean(y)
  ss1 <- var(x)*v1
  ss2 <- var(y)*v2
  sp2 <- (ss1+ss2)/(v1+v2)
  s_xbar1_xbar2 <- sqrt((sp2/n1)+(sp2/n2))
  t <- (xbar1-xbar2)/s_xbar1_xbar2
  pvalue <- 2*pt(t,v1+v2)
  out <- data.frame(n1,n2,v1,v2,xbar1,xbar2=round(xbar2,2),ss1,ss2=round(ss2,4),sp2=round(sp2,4),s_xbar1_xbar2=round(s_xbar1_xbar2,2),t=round(t,3),pvalue=round(pvalue,3))
  return(out)
}

two_tailed_t_test(group_B$exam8_1.time,group_G$exam8_1.time)
##   n1 n2 v1 v2 xbar1 xbar2   ss1    ss2    sp2 s_xbar1_xbar2      t pvalue
## 1  6  7  5  6  8.75  9.74 1.695 4.0171 0.5193           0.4 -2.476  0.031
- 성체 수컷 토끼에게 서로 다른 약물을 투여하였을 때, 두 약물의 혈액 응고 시간에 대한 평균의 차이를 독립 이표본 t-검점을 통해 확인해 보자.
- 추출된 표본으로 계산한 통계량 \(\bar{X}_B=8.75 \min \ , \ \bar{X}_G=9.74 \min\)
- 두 표본의 등분산성을 가정하였으므로 합동분산 \(S^2_p=0.5193\)
- t-값은 -2.475이고 양측 임계값은 2.201으로 좌측 임계값인 -2.201보다 t-값이 작으므로 기각역에 포함되어 귀무가설을 기각할 수 있다.
- 따라서 유의수준 5%하에 두 약물처리(B와G)에 따른 모든 성체 수컷토끼의 혈액 응고 시간은 다르다고 할 수 있다.
EXAMPLE 8.2


#데이터셋
ex8_2%>%
  kbl(caption = "Dataset",escape=F) %>%
  kable_styling(bootstrap_options = c("striped", "hover", "condensed", "responsive"))
| exam8_2.fertilizer | exam8_2.height |
|---|---|
| present | 48.2 |
| present | 54.6 |
| present | 58.3 |
| present | 47.8 |
| present | 51.4 |
| present | 52.0 |
| present | 55.2 |
| present | 49.1 |
| present | 49.9 |
| present | 52.6 |
| newer | 52.3 |
| newer | 57.4 |
| newer | 55.6 |
| newer | 53.2 |
| newer | 61.3 |
| newer | 58.0 |
| newer | 59.8 |
| newer | 54.8 |
- 식물의 길이가 새로운 비료를 줬을 때 기존 비료를 줬을 때보다 평균이 큰지 검정하고자 한다.
- 기존 비료를 10개 식물에게 새로운 비료를 8개 식물에게 줬으며 기존 비료 그룹과 새로운 비료 그룹 두개의 표본은 독립적이게 추출하였다.
##정규성,등분산성 검정
test <- function(x,y) {
  norm1 = shapiro.test(x)$p.value
  norm2 = shapiro.test(y)$p.value
  equal.var = var.test(x,y)$p.value
  summary <- list('Present Shapiro-Wilk p-value'=norm1, 'Newer Shapiro-Wilk p-value'=norm2, 'Present,Newer 등분산성검정 p-value'=equal.var)
  return(summary)
}
group_pre <- ex8_2 %>% filter(exam8_2.fertilizer=='present')
group_new <- ex8_2 %>% filter(exam8_2.fertilizer=='newer')
test(group_pre$exam8_2.height,group_new$exam8_2.height)
## $`Present Shapiro-Wilk p-value`
## [1] 0.6832982
##
## $`Newer Shapiro-Wilk p-value`
## [1] 0.9021483
##
## $`Present,Newer 등분산성검정 p-value`
## [1] 0.8743753
- shapiro.test를 통하여 기존 비료를 준 그룹에 대한 정규성검정 p-value=0.6832이고,
새로운 비료를 준 그룹에 대한 p-value는 0.9021로 둘다 유의수준 5%하에 귀무가설을 기각할 수 없다. - 즉, 유의수준 5%하에 두 집단 모두 정규성을 따르지 않는다고 할 충분한 증거가 없다.
- 등분산성 검정은 var.test을 통하여 p-value=0.8744로 정해둔 유의수준 0.05보다 크므로 유의수준 5%하에 “두 집단의 분산은 등분산이다”라는 귀무가설을 기각할 수 없다.
- 따라서 유의수준 5%하에 “두 집단의 모분산은 등분산이 아니다”라고 할 충분한 근거가 없다.
다음은 R 내장 함수로 구한 t-value이다.
t.test(group_pre$exam8_2.height,group_new$exam8_2.height,var.equal = T, alternative = "less")
##
##  Two Sample t-test
##
## data:  group_pre$exam8_2.height and group_new$exam8_2.height
## t = -2.9884, df = 16, p-value = 0.004343
## alternative hypothesis: true difference in means is less than 0
## 95 percent confidence interval:
##       -Inf -1.929255
## sample estimates:
## mean of x mean of y
##     51.91     56.55
직접 함수를 작성해서 구하여 보자.
one_tailed_t_test <- function(x,y){
  n1 <- length(na.omit(x))
  n2 <- length(na.omit(y))
  v1 <- n1-1
  v2 <- n2-1
  xbar1 <- mean(x)
  xbar2 <- mean(y)
  ss1 <- var(x)*v1
  ss2 <- var(y)*v2
  sp2 <- (ss1+ss2)/(v1+v2)
  s_xbar1_xbar2 <- sqrt((sp2/n1)+(sp2/n2))
  t <- (xbar1-xbar2)/s_xbar1_xbar2
  pvalue <- pt(t,v1+v2)
  out <- data.frame(n1,n2,v1,v2,xbar1,xbar2=round(xbar2,2),ss1=round(ss1,3),ss2=round(ss2,4), s_xbar1_xbar2=round(s_xbar1_xbar2,2),t=round(t,3),pvalue=round(pvalue,4))
  return(out)
}
one_tailed_t_test(group_pre$exam8_2.height,group_new$exam8_2.height)
##   n1 n2 v1 v2 xbar1 xbar2     ss1  ss2 s_xbar1_xbar2      t pvalue
## 1 10  8  9  7 51.91 56.55 102.229 69.2          1.55 -2.988 0.0043
- 기존의 비료보다 새로운 비료를 사용하였을 때 식물의 평균 길이가 더 길다는 것을 검정하고자 하므로 단측검정을 시행한다.
- 기종 비료를 사용하였을 때 식물 길이의 표본 평균은 51.91cm이고, 새로운 비료를 사용한 식물의 길이의 표본 평균은 56.55cm이다.
합동분산 \(S^2_p=10.71cm^2\) - t-값은 -2.9935이고 단측 임계값은 1.746으로 좌측 임계값인 -1.746보다 t-값이 작으므로 기각역에 포함되어 귀무가설을 기각할 수 있다.
- 따라서 유의수준 5%하에 기존 비료보다 새로운 비료를 사용하였을 때 식물 길이의 모평균이 크다고 할 수 있다.
EXAMPLE 8.2a
#데이터셋
ex8_2a%>%
  kbl(caption = "Dataset",escape=F) %>%
  kable_styling(bootstrap_options = c("striped", "hover", "condensed", "responsive"))
| exam8_2a.temp | exam8_2a.days |
|---|---|
| 30 | 40 |
| 30 | 38 |
| 30 | 32 |
| 30 | 37 |
| 30 | 39 |
| 30 | 41 |
| 30 | 35 |
| 10 | 36 |
| 10 | 45 |
| 10 | 32 |
| 10 | 52 |
| 10 | 59 |
| 10 | 41 |
| 10 | 48 |
| 10 | 55 |
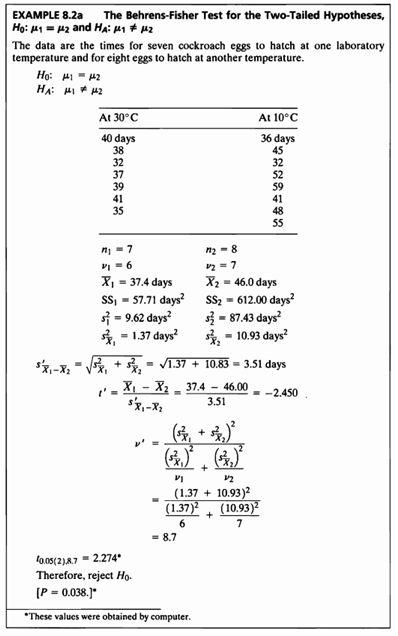
- 서로 다른 실험실 온도에서 바퀴벌레 알이 부화하는 평균 시간이 다른지 검정하고자 한다.
- 실험실 온도에 따른 바퀴벌레 알의 부화 일수 평균에 대한 가설
\(\begin{aligned} H_0 &: \mu_{30} = \mu_{10} \\ H_A &: \mu_{30} \not=\ \mu_{10} \end{aligned}\)
- 30도에서 7개의 알을, 10도에서 8개의 알이 부화하는 시간을 관찰하여 기록하였고 두개의 표본은 독립적이게 추출하였다.
##정규성,등분산성 검정
test <- function(x,y) {
  norm1 = shapiro.test(x)$p.value
  norm2 = shapiro.test(y)$p.value
  equal.var = var.test(x,y)$p.value
  summary <- list('30도 실험실 p-value'=norm1, '10도 실험실 p-value'=norm2, '30,10 등분산성검정 p-value'=equal.var)
  return(summary)
}
group_30 <- ex8_2a %>% filter(exam8_2a.temp==30)
group_10 <- ex8_2a %>% filter(exam8_2a.temp==10)

test(group_30$exam8_2a.days,group_10$exam8_2a.days)
## $`30도 실험실 p-value`
## [1] 0.7312982
##
## $`10도 실험실 p-value`
## [1] 0.9415191
##
## $`30,10 등분산성검정 p-value`
## [1] 0.01564653
- shapiro.test를 통하여 30도 실험실 그룹에 대한 정규성검정 p-value=0.7312이고,
10도 실험실 그룹에 대한 p-value는 0.9415로 둘다 유의수준 5%하에 귀무가설을 기각할 수 없다. - 즉, 유의수준 5%하에 두 집단 모두 정규성을 따르지 않는다고 할 충분한 증거가 없다.
- 등분산성 검정은 var.test을 통하여 p-value=0.0156으로 정해둔 유의수준 0.05보다 작으므로 유의수준 5%하에 “두 집단의 분산은 등분산이다”라는 귀무가설을 기각할 수 있다.
- 따라서 유의수준 5%하에 “두 집단의 모분산은 등분산이 아니다”라고 할 수 있다.
두 모집단이 정규분포를 따르지만 분산이 다른 경우는 Behrens-Fisher 검정을 이용한다.
library(asht) #Behrens-Fisher검정을 하기 위한 패키지
#sample size for t-tests with different variances and non-equal n per arm, Behrens-Fisher test, nonparametric ABC intervals, Wilcoxon-Mann-Whitney test 등등 구할 수 있다.
bfTest(group_30$exam8_2a.days,group_10$exam8_2a.days,altenative=c("two.sided"),mu=0,conf.level=0.95)
##
##  Behrens-Fisher test
##
## data:  x=group_30$exam8_2a.daysand y=group_10$exam8_2a.days
## t = -2.4437, R = 0.34076, p-value = 0.04436
## alternative hypothesis: true difference in means is not equal to 0
## 95 percent confidence interval:
##  -16.8684039  -0.2744532
## sample estimates:
## mean of x mean of y
##  37.42857  46.00000
- 30도 실험실의 바퀴벌레 알의 부화 일수 평균은 37.4days이고 10도 실험실의 바퀴벌레 알의 부화 일수 평균은 46days이다.
- t-값은 -2.44이고 양측 임계값은 2.274이다. 좌측 임계값인 -2.274보다 t-값이 작으므로 귀무가설을 기각할 수 있다.
- 따라서 온도가 30도인 실험실과 10도인 실험실에서 바퀴벌레 알의 부화 일수의 모평균에는 차이가 있다고 할 수 있다.
(95% 신뢰구간을 확인해 보면 (-16.87,-0.27)로 0을 포함하고 있지 않으므로 두 집단간 모평균에는 차이가 있다고 볼 수 있다.)
EXAMPLE 8.3

정밀도를 이용한 모평균차에 대한 표본크기계산
정밀도 d가 주어졌을 때 \(1-\alpha%\) 신뢰구간에 들어갈 수 있는 최소 표본 크기
직접 함수를 작성해서 구하여 보자.
d.sample <- function(x,y, d,alpha,en,side) {
  if(sum(is.na(x)) >= 1) {
  x=na.omit(x)
  }
  else if (sum(is.na(y)) >= 1){
    y=na.omit(y)
  }
  else
    {
    x=x
    y=y
  }
  n1= length(x)
  n2= length(y)
  df1=n1-1
  df2= n2-1
  new_df= en-1
  x.bar1= round(mean(x),2)
  x.bar2= round(mean(y),2)
  ss1=round(sum(x^2) - ((sum(x))^2/n1), 4)
  ss2=round(sum(y^2) - ((sum(y))^2/n2),4)

  sp= round((ss1 + ss2)/(df1+df2),4)
  if (side == "two"){
    ct = round(abs(qt(alpha/2,2*new_df)),3)
  }
  else{
    ct = round(abs(qt(alpha,2*new_df)),3)
  }
  size1= ceiling(2*sp*(ct^2) / (d^2))
  s=round((2*sp*(ct^2))/(0.5)^2,1)
  result <- list(spsquare=sp, '임계값'=ct, n=s ,sample_size=size1)
  return(result)
}
d.sample(group_B$exam8_1.time,group_G$exam8_1.time, 0.5, 0.05, 50,'two')
## $spsquare
## [1] 0.5193
##
## $임계값
## [1] 1.984
##
## $n
## [1] 16.4
##
## $sample_size
## [1] 17
정밀도 d=0.5이고 \(s^2_p=0.5193\) 표본크기를 50으로 추정하였을 때 \(t_{0.05(2),98}=1.984\)이고 표본크기는 16.4가 나온다.
d.sample(group_B$exam8_1.time,group_G$exam8_1.time, 0.5, 0.05, 17,'two')
## $spsquare
## [1] 0.5193
##
## $임계값
## [1] 2.037
##
## $n
## [1] 17.2
##
## $sample_size
## [1] 18
정밀도 d=0.5이고 \(s^2_p=0.5193\) 표본크기를 17로 추정하였을 때 \(t_{0.05(2),32}=2.037\)이고 표본크기는 17.2가 나온다.
d.sample(group_B$exam8_1.time,group_G$exam8_1.time, 0.5, 0.05, 18,'two')
## $spsquare
## [1] 0.5193
##
## $임계값
## [1] 2.032
##
## $n
## [1] 17.2
##
## $sample_size
## [1] 18
정밀도 d=0.5이고 \(s^2_p=0.5193\) 표본크기를 18로 추정하였을 때 \(t_{0.05(2),98}=2.032\)이고 표본크기는 17.2가 나온다.
- 표본크기를 18로 추정하였을 때가 주어진 정밀도에 가장 밀접하다.
여기서 n은 요구되는 그룹별 표본크기이다.
따라서 그룹B, 그룹G 각각 18개의 표본크기를 가져야 한다.
- 두 그룹에 대한 표본 할당비가 다른 경우 표본크기 계산법
조화 평균을 이용해서 계산한다.
그룹1의 표본크기\(n_1\)를 고정시키고 그룹 2의 표본크기\(n_2\)를 구하는 경우 (위 식과 동일)
- 예를 들어 \(n(그룹별 표본크기)=18, \ n_1=14\)인 경우
n=18
n1=14
n2=n*n1 / (2*n1-n)
n2
## [1] 25.2
- \(n_2\)=25.2 , 약 26이다.
최소 요구되는 총 표본크기는 14+26=40
EXAMPLE 8.4
 \[\begin{aligned} n &\ge \frac{2s_p^2}{\delta^2}(t_{(\frac{\alpha}{2},n_1+n_2-2)}+t_{(\beta,n_1+n_2-2)})^2 \ _{(양측)} \end{aligned}\] \[\begin{aligned} n &\ge \frac{2s_p^2}{\delta^2}(t_{(\alpha,n_1+n_2-2)}+t_{(\beta,n_1+n_2-2)})^2 \ _{(단측)} \end{aligned}\]
- 표본 크기가 100일 때,자유도=100+100-2=198이고 이에 대응되는 임계값
t_alpha <- round(qt(0.025, 198,lower.tail = F),3)
t_beta <- round(qt(0.10,198,lower.tail = F), 3)
t_alpha
## [1] 1.972
\[t_{0.05(2),198}=1.972\]
t_beta
## [1] 1.286
\[t_{0.10(1),198}=1.286\]
bound <- round(2*0.52 / 0.5^2 *(t_alpha+t_beta)^2, 1)
bound
## [1] 44.2
\[n \ge 44.2\]
- 표본 크기가 45일 때,자유도=45+45-2=88이고 이에 대응되는 임계값
t_alpha <- round(qt(0.025, 88,lower.tail = F),3)
t_beta <- round(qt(0.10,88,lower.tail = F), 3)
t_alpha
## [1] 1.987
\[t_{0.05(2),88}=1.987\]
t_beta
## [1] 1.291
\[t_{0.10(1),88}=1.291\]
bound <- round(2*0.52 / 0.5^2 *(t_alpha+t_beta)^2, 1)
bound
## [1] 44.7
\[n \ge 44.7\]
- 따라서 두 표본의 크기는 각각 최소한 45 이상이여야 한다.
- 그룹1의 표본크기\(n_1\)=30으로 고정시키고 그룹 2의 표본크기\(n_2\)를 구하는 경우
n=44.7
n1=30
n2=n*n1 / (2*n1-n)
n2
## [1] 87.64706
n(그룹별 표본 크기)은 위에서 구한 44.7로 두고 \(n_1\)=30으로 고정되어 있을 때 \(n_2\)는 88이다.
EXAMPLE 8.5
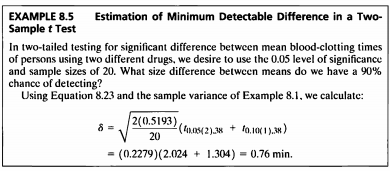
- 최소 검출차 (minimum detectable difference:MDD)
delta <- sqrt(2*0.5193 / 20)*(qt(0.025,38,lower.tail = F) + qt(0.1,38,lower.tail = F))
round(delta, 2)
## [1] 0.76
- \(n\)(표본 크기)=20, \(\alpha\)=0.05, \(\beta\)=1-0.9=0.1로 주어졌을 때 검출 가능한 최소 차이는 0.76min이다.
EXAMPLE 8.6
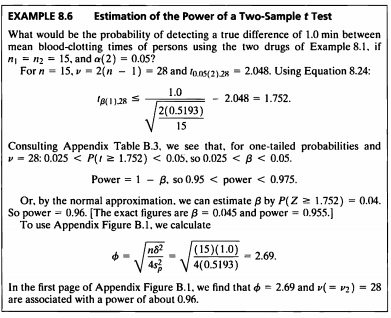
- Example 8.1에 대하여 \(n_1=n_2=15\), and \(\alpha(2)=0.05\)하에 두 약물을 사용하여 사람의 평균 혈액 응고 시간 간에 1분의 차이를 검출할 확률
- 검정력 공식
delta <- 1
n <- 15
sp <- 0.5193
t_alpha<- 2.048
t_beta <- delta/(sqrt((2*sp)/15))-t_alpha
round(t_beta,3)
## [1] 1.752

- \(P(t\geq1.752)\) (단측) 자유도=28인 확률은 (0.025,0.05)구간에 있다. 따라서 \(0.025<\beta<0.05\)
- 표준정규분포 근사 값으로 구한 정규분포 확률은 \(\beta \ by \ P(Z\geq1.752)=0.04\)이다. 따라서 power=0.96이다.

- 표를 참고하여 보면 \(\phi=2.69 \ and \ \nu(=\nu_2)=28\)은 약 0.96의 검정력과 관련이 있게 나온다.
EXAMPLE 8.7
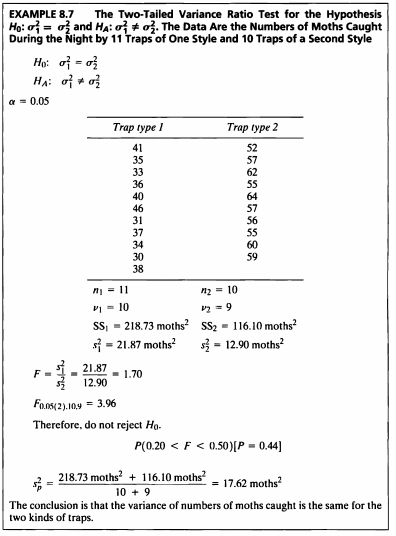
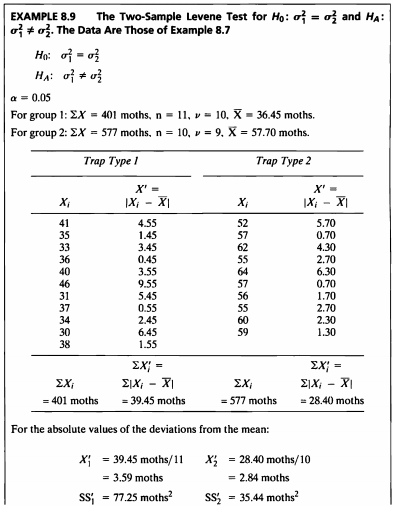
- type1,type2인 trap에 따라 잡히는 나방의 수의 표본을 구했다.
- trap 종류에 따라 잡힌 나방의 수에 대한 분산의 비가 다른가에 대한 검정으로 모집단의 분산 차이가 있는지 알아보고자 한다.
##정규성,등분산성 검정
test <- function(x,y) {
  norm1 = shapiro.test(x)$p.value
  norm2 = shapiro.test(y)$p.value
  summary <- list('type1 샤피로윌크 p-value'=norm1, 'type2 샤피로윌크 p-value'=norm2)
  return(summary)
}
group_1 <- ex8_7 %>% filter(exam8_7.trap==1)
group_2 <- ex8_7 %>%  filter(exam8_7.trap==2)

test(group_1$exam8_7.number,group_2$exam8_7.number)
## $`type1 샤피로윌크 p-value`
## [1] 0.8921986
##
## $`type2 샤피로윌크 p-value`
## [1] 0.9156178
- 분산비를 검정하기 전에 각 모집단의 표본이 정규성을 따르는지 shapiro-wilk test로 검정하였다.
- shapiro-wilk p-value가 각각 0.892, 0.916 이므로 유의수준 0.05보다 크므로 유의수준 5%하에 두 집단 모두 정규성을 따르지 않는다고 할 충분한 증거가 없다.
n1 <- length(group_1$exam8_7.number)
n2 <- length(group_2$exam8_7.number)
var1 <- round(var(group_1$exam8_7.number), 2)
var2 <- round(var(group_2$exam8_7.number), 2)
F_stat <- round(var1 / var2, 2)
list(n1=n1, n2=n2, var1=var1, var2=var2,"F"=F_stat)
## $n1
## [1] 11
##
## $n2
## [1] 10
##
## $var1
## [1] 21.87
##
## $var2
## [1] 12.9
##
## $F
## [1] 1.7
각 표본의 크기와 분산이 구해졌고 분산비 F=1.70으로 나왔다.
- \(F_{0.05(2),10,9}\)=3.96 이다. F-값=1.7이 임계값(3.96)보다 작으므로 기각역에 포함되지 않고 따라서 귀무가설을 기각할 만한 충분한 근거가 없다.
또한 p-value를 확인 하여도 유의수준 5%보다 크므로 유의수준 5%하에 유의하다고 볼 수 없다. - 즉, trap의 종류에 따라 잡힌 나방의 수의 모분산이 같지 않다고 할 수 없다.
EXAMPLE 8.8
#데이터셋
ex8_8%>%
  kbl(caption = "Dataset",escape=F) %>%
  kable_styling(bootstrap_options = c("striped", "hover", "condensed", "responsive"))
| exam8_8.site | exam8_8.time |
|---|---|
| 1 | 69.3 |
| 1 | 75.5 |
| 1 | 81.0 |
| 1 | 74.7 |
| 1 | 72.3 |
| 1 | 78.7 |
| 1 | 76.4 |
| 2 | 69.5 |
| 2 | 64.6 |
| 2 | 74.0 |
| 2 | 84.8 |
| 2 | 76.0 |
| 2 | 93.9 |
| 2 | 81.2 |
| 2 | 73.4 |
| 2 | 88.0 |
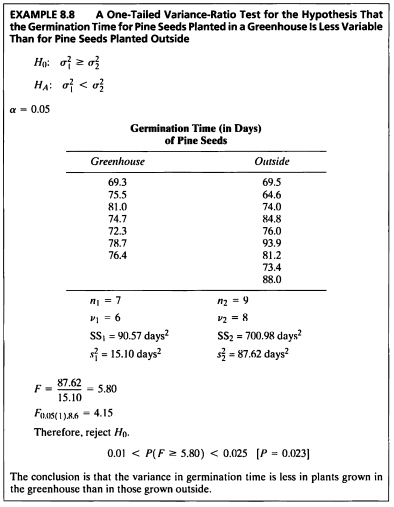
- Greenhouse,Outside에서 소나무 종자 발아 시간을 각각 측정하였다.
- 두 상황에서 추출한 두 데이터로 Outside에서의 소나무 종자 발아 시간의 모분산이 Greenhouse에서 보다 모분산이 더 큰지 검정하고자 한다.
##정규성,등분산성 검정
test <- function(x,y) {
  norm1 = shapiro.test(x)$p.value
  norm2 = shapiro.test(y)$p.value
  summary <- list('Greenhouse 샤피로윌크 p-value'=norm1, 'Outside 샤피로윌크 p-value'=norm2)
  return(summary)
}
group_G <- ex8_8 %>% filter(exam8_8.site==1)
group_O <- ex8_8 %>% filter(exam8_8.site==2)

test(group_G$exam8_8.time,group_O$exam8_8.time)
## $`Greenhouse 샤피로윌크 p-value`
## [1] 0.993425
##
## $`Outside 샤피로윌크 p-value`
## [1] 0.9566238
- 분산비를 검정하기 전에 각 모집단의 표본이 정규성을 따르는지 shapiro-wilk test로 검정하였다.
- shapiro-wilk p-value가 각각 0.993, 0.956 이므로 유의수준 0.05보다 크므로 유의수준 5%하에 두 집단 모두 정규성을 따르지 않는다고 할 충분한 증거가 없다.
n1 <- length(group_G$exam8_8.time)
n2 <- length(group_O$exam8_8.time)
var1 <- round(var(group_G$exam8_8.time), 2)
var2 <- round(var(group_O$exam8_8.time), 2)
F_stat <- round(var2 / var1, 2)
list(n1=n1, n2=n2, var1=var1, var2=var2,"F"=F_stat)
## $n1
## [1] 7
##
## $n2
## [1] 9
##
## $var1
## [1] 15.09
##
## $var2
## [1] 87.62
##
## $F
## [1] 5.81
각각의 분산은 \(s^2_1=15.10\), \(s^2_2=87.62\)이고, \(F=\frac{s^2_1}{s^2_2} \ or \ F=\frac{s^2_2}{s^2_1}\) 둘 중 큰 값을 사용한다.
따라서 \(F=\frac{s^2_2}{s^2_1}= \frac{87.62}{15.10}=5.80\)이다.- F-값이 임계값 \(F_{0.05(1),8,6}=4.15\) 보다 크므로 기각역에 포함되고 귀무가설을 기각할 수 있다.
- 따라서 Greenhouse에서 소나무 종자 발아 시간 모분산은 Outside에서 소나무 종자 발아 시간 모분산 보다 작다고 할 수 있다.
EXAMPLE 8.9
library(lawstat) #levene test를 위한 패키지
levene.test(ex8_7$exam8_7.number,ex8_7$exam8_7.trap,location='mean')
##
##  Classical Levene's test based on the absolute deviations from the mean
##  ( none not applied because the location is not set to median )
##
## data:  ex8_7$exam8_7.number
## Test Statistic = 0.49267, p-value = 0.4913
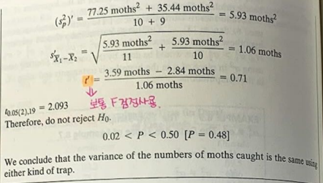
- Levene test를 통하여 분산의 동일성 검정을 할 수 있다.
- Levene test는 모집단이 정규분포를 따르지 않는 경우에 모분산의 동질성을 검정하기 위하여 사용한다.
- p-value = 0.4913으로 출력된 것을 볼 수 있다. 그러므로 유의수준 5%하에서 귀무가설을 기각할 충분한 근거가 없다.
두 종류의 trap에 따라 잡히는 나방의 수의 모분산이 같지 않다는 증거가 충분하지 않다고 할 수 있다.
EXAMPLE 8.10
#데이터셋
ex8_10%>%
  kbl(caption = "Dataset",escape=F) %>%
  kable_styling(bootstrap_options = c("striped", "hover", "condensed", "responsive"))
| exam8_10.weight | exam8_10.height |
|---|---|
| 72.5 | 183.0 |
| 71.7 | 172.3 |
| 60.8 | 180.1 |
| 63.2 | 190.2 |
| 71.4 | 191.4 |
| 73.1 | 169.6 |
| 77.9 | 166.4 |
| 75.7 | 177.6 |
| 72.0 | 184.7 |
| 69.0 | 187.5 |
| NA | 179.8 |
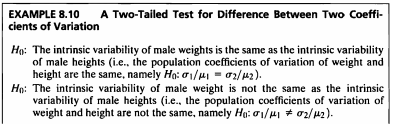
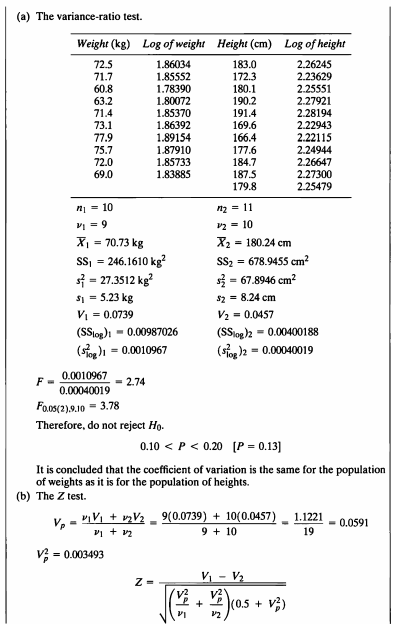
- 같은 모집단에서 추출된 남성의 키와 몸무게의 변동이 다른지를 검정하고자 한다.
- 키의 측정 단위는 cm이고, 몸무게의 측정단위는 kg이다.
- 단위가 다른 두 데이터의 비교를 위해 변동계수 (coefficients of variantion)을 산출하여 비교하였다.
- 따라서 가설은 다음과 같이 설정할 수 있다.
##정규성,등분산성 검정
test <- function(x,y) {
  norm1 = shapiro.test(x)$p.value
  norm2 = shapiro.test(y)$p.value
  summary <- list('weight 샤피로윌크 p-value'=norm1, 'height 샤피로윌크 p-value'=norm2)
  return(summary)
}

test(ex8_10$exam8_10.weight,ex8_10$exam8_10.height)
## $`weight 샤피로윌크 p-value`
## [1] 0.2660832
##
## $`height 샤피로윌크 p-value`
## [1] 0.7483809
- p-value가 각각 \(p\ value=0.2661,\ 0.7484\) 으로 유의수준 0.05보다 크기에 귀무가설 \(H_0\) 를 기각할만한 충분한 근거가 없다. 데이터셋이 정규성을 따르지 않는다는 충분한 근거가 없기에 분산 비의 검정을 수행할 수 있다.
분산비 검정을 하기 위하여 통계량 구하는 함수를 작성하여 보자.
library(kableExtra)
f8_10 <- function(x,y){
  x <- na.omit(x)
  y <- na.omit(y)
  n1 <- length(x)
  n2 <- length(y)
  v1 <- n1-1
  v2 <- n2-1
  xbar1 <- mean(x)
  xbar2 <- mean(y)
  s1 <-var(x)
  s2 <- var(y)
  ss1 <- var(x)*v1
  ss2 <- var(y)*v2
  sd1 <- sd(x)
  sd2 <- sd(y)
  cv1 <- sd1/xbar1
  cv2 <- sd2/xbar2
  sslog1 <- var(log10(x))*v1
  sslog2 <- var(log10(y))*v2
  slog1 <- var(log10(x))
  slog2 <- var(log10(y))
  if(slog1 > slog2){
    f <- slog1/slog2
  }
  else{
    f <- slog2/slog1
  }
  pvalue <- 2*(1-pf(f,max(v1,v2),min(v1,v2)))
  if(pvalue < 0.05){
    Reject_H0 <- "yes"
    sp2 <- NA
  }
  else{
    Reject_H0 <- "No"
  }
  out1 <- c(n=n1,v=v1,xbar=round(xbar1,2), s_2=round(s1,4),s=round(ss1,4),CV =round(cv1,4),SSlog=round(sslog1,8),s_2log=round(slog1,8),F=round(f,2),
            pvalue=round(pvalue,2),Reject_H0)
  out2 <- c(n=n2,v=v2,xbar=round(xbar2,2), s_2=round(s2,4),s=round(ss2,4),CV =round(cv2,4),SSlog=round(sslog2,8),s_2log=round(slog2,8),F=round(f,2),
            pvalue=round(pvalue,2),Reject_H0)
  out <-as.data.frame(cbind(out1,out2))
  names(out) <- c("Weight","Height")
  rownames(out)[11] <- "Reject_H0"
  return(out)
}

f8_10(ex8_10$exam8_10.weight,ex8_10$exam8_10.height) %>%
  kbl(caption = "Result of Variance ratio test") %>%
  kable_styling(bootstrap_options = c("striped", "hover", "condensed", "responsive"))
| Weight | Height | |
|---|---|---|
| n | 10 | 11 |
| v | 9 | 10 |
| xbar | 70.73 | 180.24 |
| s_2 | 27.3512 | 67.8945 |
| s | 246.161 | 678.9455 |
| CV | 0.0739 | 0.0457 |
| SSlog | 0.00986951 | 0.00400214 |
| s_2log | 0.00109661 | 0.00040021 |
| F | 2.74 | 2.74 |
| pvalue | 0.14 | 0.14 |
| Reject_H0 | No | No |
- 몸무게의 CV=0.0739, 키의 CV=0.0457
- Lewontin은 data를 logarithmic transformation하여 변동계수 검정을 수행하는 방법을 증명하였다.
각 표본의 data들에 log10 변환을 하여 산출한 분산은 몸무게=0.0010967, 키=0.00040019이고,
이를 활용한 F-value는 \(F=\frac{0.0010967}{0.00040019}=2.74\)이다.
임계값보다 F-value가 작으므로 귀무가설을 기각할 수 없다.
즉, 같은 모집단으로부터 추출된 남성의 키와 몸무게의 변동은 다르다고 할 증거가 충분하지 못하다.
cv1 <- as.numeric(f8_10(ex8_10$exam8_10.weight,ex8_10$exam8_10.height)$Weight[6])
cv2 <- as.numeric(f8_10(ex8_10$exam8_10.weight,ex8_10$exam8_10.height)$Height[6])
v1 <- as.numeric(f8_10(ex8_10$exam8_10.weight,ex8_10$exam8_10.height)$Weight[2])
v2 <- as.numeric(f8_10(ex8_10$exam8_10.weight,ex8_10$exam8_10.height)$Height[2])
vp <- (v1*cv1+v2*cv2)/(v1+v2)
vp2 <- round(vp,4)^2
Z <- (cv1-cv2)/sqrt(((vp2/v1)+(vp2/v2))*(0.5+vp2))
pvalue <- 2*(1-pt(Z,v1+v2))

if(pvalue < 0.05){
  Reject_H0 <- "yes"
}else{
  Reject_H0 <- "No"
}

ztest <- data.frame(vp=round(vp,4),vp2=round(vp2,6),Z=round(Z,2),pvalue=round(pvalue,2),Reject_H0)
ztest%>%
  kbl(caption = "Result of Z test") %>%
  kable_styling(bootstrap_options = c("striped", "hover", "condensed", "responsive"))
| vp | vp2 | Z | pvalue | Reject_H0 |
|---|---|---|---|---|
| 0.0591 | 0.003493 | 1.46 | 0.16 | No |
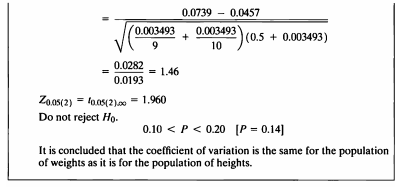
- Miller는 공통 변동계수를 산출하여 Z분포를 활용해 변동계수 차에 대한 가설 검정을 수행하였다.
공통 변동계수는 \(V_p=\frac{\nu_1V1+\nu_2V2}{\nu_1+\nu_2}=\frac{9(0.0739)+10(0.0457)}{9+10}=0.0591\)이다.
공통 변동계수를 활용한 Z-value=1.46이고, 유의수준 5%하에서 임계값 z=1.96이다.
z-value가 임계값 보다 작으므로, 기각역에 포함되지 않아 귀무가설을 기각할 수 없다.
즉, 같은 모집단으로부터 추출된 남성 키와 몸무게의 변동은 다르다고 하기 어렵다.
EXAMPLE 8.11
#데이터셋
ex8_11%>%
  kbl(caption = "Dataset",escape=F) %>%
  kable_styling(bootstrap_options = c("striped", "hover", "condensed", "responsive"))
| exam8_11.sex | exam8_11.height |
|---|---|
| 1 | 193 |
| 1 | 188 |
| 1 | 185 |
| 1 | 183 |
| 1 | 180 |
| 1 | 175 |
| 1 | 170 |
| 2 | 178 |
| 2 | 173 |
| 2 | 168 |
| 2 | 165 |
| 2 | 163 |
- 본 데이터는 성인 남성과 여성의 키를 기록한 데이터이다.
- 데이터를 그룹별로 나누어 보자.
hm <- ex8_11 %>% filter(exam8_11.sex=='1')
hf <- ex8_11 %>% filter(exam8_11.sex=='2')

library(qpcR) # 결측치 있는 데이터 cbind
ex8_11_cbind<- data.frame(qpcR:::cbind.na(hm[,2], hf[,2]))
names(ex8_11_cbind) <- c("Heights of males","Heights of females")
males와 females 데이터 수가 차이나기 때문에 cbind가 되지 않으므로 qpcR패키지를 사용하여 결합시켜준다.
ex8_11_cbind%>%
  kbl(caption = "Dataset",escape=F) %>%
  kable_styling(bootstrap_options = c("striped", "hover", "condensed", "responsive"))
| Heights of males | Heights of females |
|---|---|
| 193 | 178 |
| 188 | 173 |
| 185 | 168 |
| 183 | 165 |
| 180 | 163 |
| 175 | NA |
| 170 | NA |
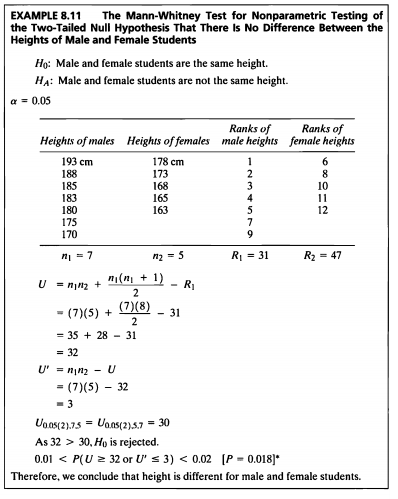
- 남학생과 여학생 키의 차이에 대한 검정을 하고자 한다.
- 일반적인 t-검정을 수행하기엔 표본의 수가 적어 비모수 검정 방법인 Mann-Whitney검정을 실시한다.
- Mann-Whitney 검정을 하기 위해서는 각 변수의 랭크(순위)를 매겨야하기 때문에 이를 구하도록 한다.
(이 예제의 경우 내림차순으로 순위를 구했다. 양측일 경우 문제 없지만 단측일 경우 통계량 값이 바뀐다.)
rank8_11 <- function(data){
  x <- data[,1]
  y <- data[,2]
  h <- as.numeric(rbind(c(x,y)))
  rank <- rank(-h, na.last = "keep")
  gender <- c(rep("m",length(x)),rep("f",length(y)))
  out <- data.frame(h,rank,gender)
  data$rank_m <- subset(out$rank, gender=="m")
  data$rank_f <- subset(out$rank, gender=="f")
  return(data)
}

dat8_11 <- rank8_11(data=ex8_11_cbind)

dat8_11%>%
  kbl(caption = "Result of Rank") %>%
  kable_styling(bootstrap_options = c("striped", "hover", "condensed", "responsive"))
| Heights of males | Heights of females | rank_m | rank_f |
|---|---|---|---|
| 193 | 178 | 1 | 6 |
| 188 | 173 | 2 | 8 |
| 185 | 168 | 3 | 10 |
| 183 | 165 | 4 | 11 |
| 180 | 163 | 5 | 12 |
| 175 | NA | 7 | NA |
| 170 | NA | 9 | NA |
- Mann-Whitney 검정통계량을 구하는 공식은 다음과 같다.
\(U'=n_2n_1 + \frac{n_2(n_2+1)}{2}-R_2\)
- \(U'\)을 쉽게 구하는 방법이 있다.
- 본 검정에서 임계값을 테이블을 통해확인하여 보자.

- 양측 0.05 n=5,7의 임계값은 30인 것을 볼 수 있다.
M_W_test <- function(x,y,a,b){
  x <- na.omit(x)
  y <- na.omit(y)
  a <- na.omit(a)
  b <- na.omit(b)
  n1 <- length(x)
  n2 <- length(y)
  r1 <- sum(a)
  r2 <- sum(b)
  u <- n1*n2+(n1*(n1+1)/2)-r1
  u_prime <- n1*n2-u
  out <- data.frame(n1,n2,R1=r1,R2=r2,U=u,U_prime=u_prime)
  return(out)
}
M_W_test(dat8_11$`Heights of males`,dat8_11$`Heights of females`,dat8_11$rank_m,dat8_11$rank_f) %>%
  kbl(caption = "Result of Mann-Whitney test") %>%
  kable_styling(bootstrap_options = c("striped", "hover", "condensed", "responsive"))
| n1 | n2 | R1 | R2 | U | U_prime |
|---|---|---|---|---|---|
| 7 | 5 | 31 | 47 | 32 | 3 |
- 이 검정은 양측검정이기 때문에 \(U, \ U'\) 중 하나가 임계값보다 크거나 같으면 귀무가설을 기각한다.
- 임계값 U는 30으로 나왔고, 임계값보다 산출된 \(U\) 통계량 32가 더 크므로 유의수준 5%하에 귀무가설을 기각할 수 있다.
즉, 남학생과 여학생의 키는 유의수준 5%하에서 다르다고 할 수 있다.
다음은 R에 내장된 wilcox.text() 를 사용한 결과를 확인하여 보자.
wilcox.test(dat8_11$`Heights of males`, dat8_11$`Heights of females`)
##
##  Wilcoxon rank sum exact test
##
## data:  dat8_11$`Heights of males` and dat8_11$`Heights of females`
## W = 32, p-value = 0.01768
## alternative hypothesis: true location shift is not equal to 0
- wilcoxon rank sum exact test의 p-value=0.018로 유의수준 5%하에서 귀무가설을 기각할 수 있다.
그러므로 남학생과 여학생의 키는 다르다고 할 수 있다.
EXAMPLE 8.12
#데이터셋
wt <- c(44,48,36,32,51,45,54,56)
wot <- c(32,40,44,44,34,30,26,NA)
ex8_12 <- data.frame(wt,wot)
ex8_12%>%
  kbl(caption = "Dataset",escape=F) %>%
   kable_styling(bootstrap_options = c("striped", "hover", "condensed", "responsive"))
| wt | wot |
|---|---|
| 44 | 32 |
| 48 | 40 |
| 36 | 44 |
| 32 | 44 |
| 51 | 34 |
| 45 | 30 |
| 54 | 26 |
| 56 | NA |
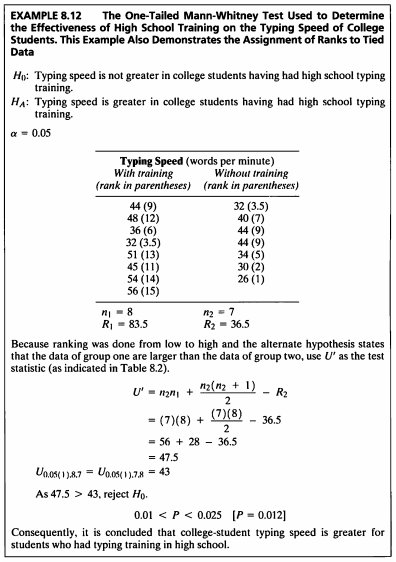
- 고등학교에서 typing 훈련을 받은 대학생이 훈련을 받지 않은 사람보다 평균속도가 좋은지 검정하고자 한다.
- Mann-Whitney 검정을 하기 위해서는 각 변수의 랭크(순위)를 매겨야하기 때문에 이를 구하도록 한다.
(이 예제의 경우 오름차순으로 순위를 구했다.) - 동률 순위 자료가 있는 경우 동률 순위의 평균 순위를 이용한다.
rank8_12 <- function(data){
  x <- data[,1]
  y <- data[,2]
  h <- as.numeric(rbind(c(x,y)))
  rank <- rank(h, na.last = "keep")
  gender <- c(rep("m",length(x)),rep("f",length(y)))
  out <- data.frame(h,rank,gender)
  data$rank_m <- subset(out$rank, gender=="m")
  data$rank_f <- subset(out$rank, gender=="f")
  return(data)
}
dat8_12 <- rank8_12(data=ex8_12)

dat8_12%>%
  kbl(caption = "Result of Rank") %>%
   kable_styling(bootstrap_options = c("striped", "hover", "condensed", "responsive"))
| wt | wot | rank_m | rank_f |
|---|---|---|---|
| 44 | 32 | 9.0 | 3.5 |
| 48 | 40 | 12.0 | 7.0 |
| 36 | 44 | 6.0 | 9.0 |
| 32 | 44 | 3.5 | 9.0 |
| 51 | 34 | 13.0 | 5.0 |
| 45 | 30 | 11.0 | 2.0 |
| 54 | 26 | 14.0 | 1.0 |
| 56 | NA | 15.0 | NA |
이제 Mann-Whitney 검정통계량을 구해 검정을 실시하도록 한다.
M_W_test(dat8_12$wt,dat8_12$wot,dat8_12$rank_m,dat8_12$rank_f) %>%
  kbl(caption = "Result of Mann-Whitney test") %>%
  kable_styling(bootstrap_options = c("striped", "hover", "condensed", "responsive"))
| n1 | n2 | R1 | R2 | U | U_prime |
|---|---|---|---|---|---|
| 8 | 7 | 83.5 | 36.5 | 8.5 | 47.5 |
- 본 검정에서 임계값을 테이블을 통해확인하여 보자.

단측 0.05 n=7,8의 임계값은 43인 것을 볼 수 있다.
이 검정은 단측검정이기 때문에 다음의 표를 확인하여야 한다.

- 이 예제는 오름차순으로 순위가 매겨져 있으며, 훈련받은 학생의 평균속도가 더 좋은지 검정하는 것이기 때문에 통계량을 \(U'\)을 사용한다.
- 임계값은 43으로 나왔고, 임계값보다 산출된 \(U'\) 통계량 47.5가 더 크므로 유의수준 5%하에 귀무가설을 기각할 수 있다.
즉, 고등학교에서 typing 훈련을 받은 학생은 훈련을 받지 않은 학생보다 typing 평균 속도가 빠르다고 할 수 있다.
다음은 R에 내장된 wilcox.text() 를 사용한 결과를 확인하여 보자.
wilcox.test(dat8_12$wt,na.omit(dat8_12$wot),alternative = "greater")
##
##  Wilcoxon rank sum test with continuity correction
##
## data:  dat8_12$wt and na.omit(dat8_12$wot)
## W = 47.5, p-value = 0.0136
## alternative hypothesis: true location shift is greater than 0
- wilcoxon rank sum exact test의 p-value=0.0136으로 유의수준 5%하에서 귀무가설을 기각할 수 있다.
그러므로 고등학교에서 typing 훈련을 받은 학생은 훈련을 받지 않은 학생보다 typing 평균 속도가 빠르다고 할 수 있다.
EXAMPLE 8.13
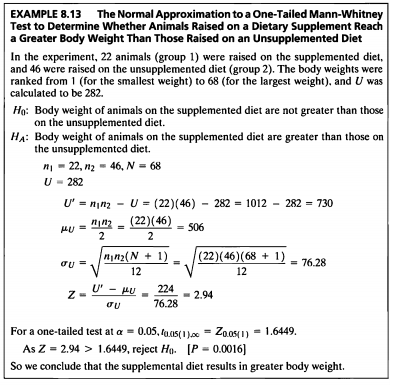
- 본 데이터는 보충제를 섭취 유무에 따른 동물들의 체중을 기록한 데이터로 단측 검정에서의 Mann-Whitney 검정을 실시할 때의 정규 근사를 보여주는 예시이다.
- Mann-Whitney 검정에서 두 그룹의 표본이 20 이상이고 두 표본의 크기 합이 40이상일 경우 정규 근사가 가능하다.
- 각 표본의 sample sizw는 20을 넘어 Mann-Whitney의 정규근사를 이용하여 검정을 수행하였다.
\[\mu_U=\frac{n_1n_2}{2} \ (=\frac{U+U'}{2}), \ \sigma_U=\sqrt{\frac{n_1n_1(N+1)}{12}}\]Mann-Whitney의 정규근사를 위한 통계량
\(\rightarrow \space Z= \frac{U-\mu_U}{\sigma_U}\ \sim\ N(0,1)\)
- \(n_1=22,\ n_2=46,\ N=68,\ U=282\) 가 주어졌을 때 검정을 해보도록 한다.
Normal_Approximation_M_W_test<-function(n1,n2,u){
  u_prime<-(n1*n2)-u
  mu<-(n1*n2)/2
  sig<-sqrt(((n1*n2)*(n1+n2+1))/12)
  z<-(u_prime -mu)/sig
  pvalue <- 1-pnorm(z)
  if(pvalue < 0.05){
    Reject_H0 <- "yes"
  }else{
    Reject_H0 <- "No"
  }
  out <- data.frame(u_prime,mu,sig=round(sig,2),z=round(z,2),p_value=round(pvalue,4),Reject_H0)
  return(out)
}
Normal_Approximation_M_W_test(22,46,282) %>%
  kbl(caption = "Result of Mann-Whitney test (Normal approxiation)") %>%
  kable_styling(bootstrap_options = c("striped", "hover", "condensed", "responsive"))
| u_prime | mu | sig | z | p_value | Reject_H0 |
|---|---|---|---|---|---|
| 730 | 506 | 76.28 | 2.94 | 0.0017 | yes |
- 이 예제는 오름차순으로 순위가 매겨져 있으며, 음식 보충제를 섭취한 동물의 체중이 음식 보충제를 섭취하지 않은 동물의 체중보다 큰지 검정하는 것이기 때문에 통계량을 \(U'\)을 사용한다.
- 산출된 통계량을 이용하여 \(Z=\frac{U'-\mu_U}{\sigma_U}=2.94\)이고, 표준정규분포에서 유의수준 5% 단측검정 임계값은 1.6449이다.
계산된 통계량 값이 임계값 보다 크고, 기각역에 포함되므로 귀무가설을 기각할 수 있다. - 따라서 음식 보충제를 섭취한 동물의 체중은 음식 보충제를 섭취하지 않은 동물의 체중보다 많이 나간다고 말할 수 있다.
EXAMPLE 8.14
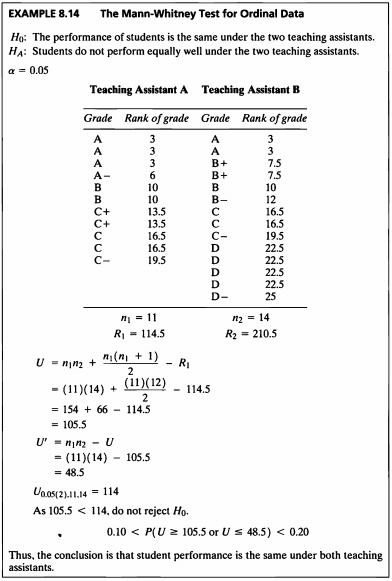
- 연속형 데이터가 아닌 순서(순위)만 있는 데이터의 검정을 해보도록 한다.
- 본 데이터는 수업 조교에 따른 학생들의 성적 등급을 기록한 데이터로 수업 조교에 따른 학생들의 등급이 같은지 다른지 검정해보도록 한다.
A <- c(3,3,3,6,10,10,13.5,13.5,16.5,16.5,19.5,NA,NA,NA)
B <- c(3,3,7.5,7.5,10,12,16.5,16.5,19.5,22.5,22.5,22.5,22.5,25)
ex8_14 <- data.frame(A,B)
ex8_14%>%
  kbl(caption = "Dataset",escape=F) %>%
   kable_styling(bootstrap_options = c("striped", "hover", "condensed", "responsive"))
| A | B |
|---|---|
| 3.0 | 3.0 |
| 3.0 | 3.0 |
| 3.0 | 7.5 |
| 6.0 | 7.5 |
| 10.0 | 10.0 |
| 10.0 | 12.0 |
| 13.5 | 16.5 |
| 13.5 | 16.5 |
| 16.5 | 19.5 |
| 16.5 | 22.5 |
| 19.5 | 22.5 |
| NA | 22.5 |
| NA | 22.5 |
| NA | 25.0 |
rank_M_W_test <- function(x,y){
  x <- na.omit(x)
  y <- na.omit(y)
  n1 <- length(x)
  n2 <- length(y)
  r1 <- sum(x)
  r2 <- sum(y)
  u <- n1*n2+(n1*(n1+1)/2)-min(r1,r2)
  u_prime <- n1*n2-u
  out <- data.frame(n1,n2,R1=r1,R2=r2,U=u,U_prime=u_prime)
  return(out)
}
rank_M_W_test(ex8_14$A,ex8_14$B)%>%
  kbl(caption = "Result of Mann-Whitney test (Normal approxiation)") %>%
  kable_styling(bootstrap_options = c("striped", "hover", "condensed", "responsive"))
| n1 | n2 | R1 | R2 | U | U_prime |
|---|---|---|---|---|---|
| 11 | 14 | 114.5 | 210.5 | 105.5 | 48.5 |
\(U\) 통계량은 주어진 공식에 따라 \(U, U'\)을 모두 구하고 둘 중 큰 값을 \(U\) 통계량으로 한다.**
계산 결과 \(U=105.5, \ U'=48.5\)로 \(U\)값이 더 크기 때문에 통계량은 105.5가 된다.

- 임계값은 U_0.05(11,14)=114이므로 통계량이 임계값보다 작아 귀무가설을 기각할 수 없고 따라서 어시스턴트에 따라 학생들의 학업 성취도가 다르다고 말할 수 없다.**
다음은 R에 내장된 wilcox.text() 를 사용한 결과이다.
wilcox.test(na.omit(ex8_14$A),ex8_14$B,alternative = "two.sided")
##
##  Wilcoxon rank sum test with continuity correction
##
## data:  na.omit(ex8_14$A) and ex8_14$B
## W = 48.5, p-value = 0.1219
## alternative hypothesis: true location shift is not equal to 0
- wil.cox test를 이용해 검정할 수도 있으며 패키지를 이용해 wilcox.test검정을 진행한 결과 p-value가 0.1219로 유의수준 0.05보다 크기 때문에 귀무가설을 기각할 수 없다.
EXAMPLE 8.15
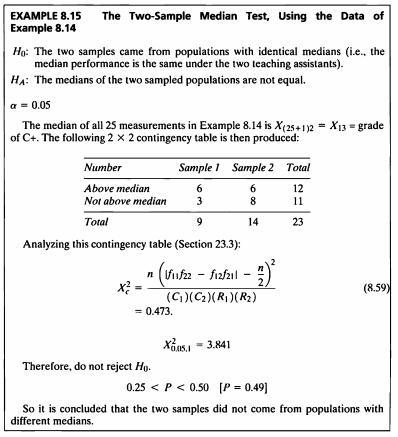
- Example 8.14 데이터를 사용해서 중위수 검정을 실시해보도록 한다.
data <- c(na.omit(ex8_14$A),ex8_14$B)
ex8_15 <- data.frame(data)
ex8_15$number <- ifelse(ex8_15$data > median(ex8_15$data) ,
                         ex8_15$number <- "Not above Median",ifelse(ex8_15$data == median(ex8_15$data),NA,ex8_15$number <- "Above Median"))
group<-c(rep("Sample 1",11), rep("Sample 2",14))
ex8_15$group <- group
ex8_15 <- na.omit(ex8_15)
table(ex8_15$number,ex8_15$group)%>%
  kbl(caption = "Result of Mann-Whitney test") %>%
  kable_styling(bootstrap_options = c("striped", "hover", "condensed", "responsive"))
| Sample 1 | Sample 2 | |
|---|---|---|
| Above Median | 6 | 6 |
| Not above Median | 3 | 8 |
- 교차표를 보면 1번 그룹에선 중위수를 넘는 학생이 6명이고 넘지 않는 학생이 3명이며, 2번 그룹에서는 6명과 8명이다.
- 중위수 검정을 하기 위해 pearson 카이제곱 검정을 실시한다. 카이제곱 검정을 하기 위한 검정통계량 공식은 다음과 같다.
chi_square_test<- function(table){
  tab <- table
  f11 <- tab[1,1]
  f22 <- tab[2,2]
  f12 <- tab[1,2]
  f21 <- tab[2,1]
  C1 <- sum(tab[,1])
  C2 <- sum(tab[,2])
  R1 <- sum(tab[1,])
  R2 <- sum(tab[2,])
  n <- sum(R1,R2)
  chis <- (n*(abs(f11*f22-f12*f21)-(n/2))^2)/(C1*C2*R1*R2)
  pvalue <- min(pchisq(chis,1),1-pchisq(chis,1))
  out <- data.frame(chi=round(chis,3),pvalue=round(pvalue,2))
  return(out)
}

chi_square_test(table(ex8_15$number,ex8_15$group))%>%
  kbl(caption = "Result of Chi-square test") %>%
  kable_styling(bootstrap_options = c("striped", "hover", "condensed", "responsive"))
| chi | pvalue |
|---|---|
| 0.473 | 0.49 |
- 빈도표를 생성하여 산출한 통계량은 0.473이고, 자유도가 1인 카이제곱 통계량은 3.841임을 알 수 있다.
- 통계량이 기각역에 포함되지 않으므로 귀무가설을 기각할 수 없다.
- 즉, 같은 모집단으로부터 추출된 두 표본의 중위수는 다르다고 할 수 없다.
- 그러므로 수업 조교에 따른 학생들의 성적 등급의 중위수가 다르다고 할 수 없다.
RVAideMemoire 패키지 내에 있는 mood.medtest() 함수를 사용한 결과를 확인하여 보자.
library(RVAideMemoire)
mood.medtest(ex8_15$data~ex8_15$group,exact=F)
##
##  Mood's median test
##
## data:  ex8_15$data by ex8_15$group
## X-squared = 0.47329, df = 1, p-value = 0.4915
- gmodels 패키지 내에 있는 CrossTable() 함수를 사용한 결과를 확인하여 보자.
library(gmodels)
CrossTable(ex8_15$number,ex8_15$group, prop.r=F, prop.c=F, prop.t=F, chisq=T,digits=3,prop.chisq=F)
##
##
##    Cell Contents
## |-------------------------|
## |                       N |
## |-------------------------|
##
##
## Total Observations in Table:  23
##
##
##                  | ex8_15$group
##    ex8_15$number |  Sample 1 |  Sample 2 | Row Total |
## -----------------|-----------|-----------|-----------|
##     Above Median |         6 |         6 |        12 |
## -----------------|-----------|-----------|-----------|
## Not above Median |         3 |         8 |        11 |
## -----------------|-----------|-----------|-----------|
##     Column Total |         9 |        14 |        23 |
## -----------------|-----------|-----------|-----------|
##
##
## Statistics for All Table Factors
##
##
## Pearson's Chi-squared test
## ------------------------------------------------------------
## Chi^2 =  1.244589     d.f. =  1     p =  0.2645885
##
## Pearson's Chi-squared test with Yates' continuity correction
## ------------------------------------------------------------
## Chi^2 =  0.4732894     d.f. =  1     p =  0.4914778
##
##
EXAMPLE 8.16
Michigan <- c(47,35,7,5,3,2)
Louisiana <- c(48,23,11,13,8,2)
ex8_16 <- data.frame(Michigan,Louisiana)
ex8_16%>%
  kbl(caption = "Dataset",escape=F) %>%
  kable_styling(bootstrap_options = c("striped", "hover", "condensed", "responsive"))
| Michigan | Louisiana |
|---|---|
| 47 | 48 |
| 35 | 23 |
| 7 | 11 |
| 5 | 13 |
| 3 | 8 |
| 2 | 2 |
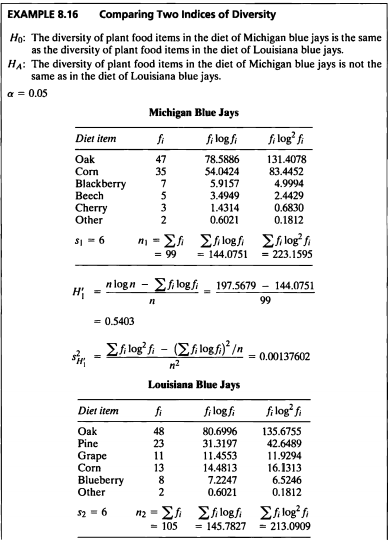
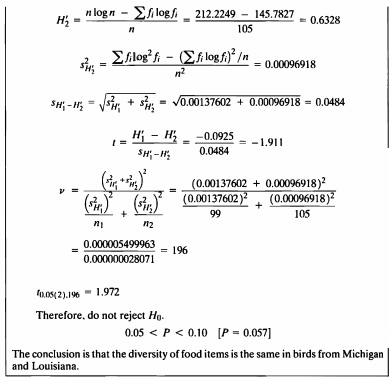
- 이 데이터는 미시간 블루제이스의 식단에서 식물성 식품의 빈도와 루이지애나 블루제이스의 식단에서 식물성 식품의 빈도 데이터이다.
- 독립적인 두개의 표본에 대하여 다양성 지수 차이를 검정하기 위해서는 Shannon index H 를 구하고 허치슨이 제안한 검정통계량을 구하여 검정을 진행하여야 한다.
- 통계량들을 구하는 공식은 다음과 같다.
H_test<- function(x,y){
  n1 <- sum(x)
  filog_1 <- sum(x*log10(x))
  filog2_1 <- sum(x*log10(x)^2)
  h1 <- (n1*log10(n1)-filog_1)/n1
  sh1 <- (filog2_1-(filog_1^2/n1))/n1^2
  n2 <- sum(y)
  filog_2 <- sum(y*log10(y))
  filog2_2 <- sum(y*log10(y)^2)
  h2 <- (n2*log10(n2)-filog_2)/n2
  sh2 <- (filog2_2-(filog_2^2/n2))/n2^2
  s_h1_h2 <- sqrt(sh1+sh2)
  t <- (h1-h2)/s_h1_h2
  v <- (sh1+sh2)^2/( (sh1^2/n1) + (sh2^2/n2) )
  pvalue <- 2*min(pt(t,v),1-pt(t,v))
  if(pvalue < 0.05){
    Reject_H0 <- "yes"
  }else{
    Reject_H0 <- "No"
  }
  out <- data.frame(h1=round(h1,4),h2=round(h2,4),sh1,sh2,s_h1_h2=round(s_h1_h2,4),t=round(t,3),v=round(v),p_value=round(pvalue,3),Reject_H0)
  return(out)
}
H_test(ex8_16$Michigan,ex8_16$Louisiana)%>%
  kbl(caption = "Result of indices of diversity") %>%
  kable_styling(bootstrap_options = c("striped", "hover", "condensed", "responsive"))
| h1 | h2 | sh1 | sh2 | s_h1_h2 | t | v | p_value | Reject_H0 |
|---|---|---|---|---|---|---|---|---|
| 0.5403 | 0.6328 | 0.001376 | 0.0009692 | 0.0484 | -1.909 | 196 | 0.058 | No |
다양성 지수 \(H\) 는 vegan 패키지에 있는 diversity() 함수를 사용해서도 계산이 가능하다.
library(vegan)
h1_1<-diversity(ex8_16$Michigan, index="shannon", base=10)
h2_2<-diversity(ex8_16$Louisiana, index="shannon", base=10)
c(round(h1_1,4),round(h2_2,4))==c(H_test(ex8_16$Michigan,ex8_16$Louisiana)$h1,H_test(ex8_16$Michigan,ex8_16$Louisiana)$h2)
## [1] TRUE TRUE
cat(" diversity() 함수로 구한 다양성 지수 : H1 = ",round(h1_1,4),"  H2 = ",round(h2_2,4),"\n",
    "직접 코딩한 함수로 구한 다양성 지수 : H1 = ",H_test(ex8_16$Michigan,ex8_16$Louisiana)$h1,"  H2 = ",H_test(ex8_16$Michigan,ex8_16$Louisiana)$h2,"\n",
    "두 다양성 지수가 동일한가?  H1 : ",round(h1_1,4)==H_test(ex8_16$Michigan,ex8_16$Louisiana)$h1,"   H2 : ",round(h2_2,4)==H_test(ex8_16$Michigan,ex8_16$Louisiana)$h2)
##  diversity() 함수로 구한 다양성 지수 : H1 =  0.5403   H2 =  0.6328
##  직접 코딩한 함수로 구한 다양성 지수 : H1 =  0.5403   H2 =  0.6328
##  두 다양성 지수가 동일한가?  H1 :  TRUE    H2 :  TRUE
- 다양성 지수 검정 결과 검정통계량 \(t=-1.909\) 이고 \(p-value=0.058\)로 유의수준 0.05보다 크므로 귀무가설 \(H_0\) 를 기각할 충분한 근거를 가지고 있지 않다.
- 두 Shannon index를 비교해도 미시간 주는 0.5403, 루이지애나는 0.6328로 루이지애나의 식물성 식품에 대한 종 부유도와 종 균등도가 크다고 할수 있겠지만 다양성 지수 검정 결과 미시간 주와 루이지애나 주의 다양성 지수가 같지 않다는 귀무가설을 기각할 충분한 근거가 없다.
- 그러므로 미시간주와 루이지애나 주의 다양성 지수는 같지 않다는 충분한 근거가 없다.
SAS 프로그램 결과
SAS 접기/펼치기 버튼
8장
LIBNAME ex 'C:\Biostat';
RUN;

/*8장 연습문제 불러오기*/
%MACRO chap08(name=,no=);
%do i=1 %to &no.;
	PROC IMPORT DBMS=excel
		DATAFILE="C:\Biostat\data_chap08"
		OUT=ex.&name.&i. REPLACE;
		RANGE="exam8_&i.$";
	RUN;
%end;
%MEND;

%MACRO chap08_2(name=,no=);
	PROC IMPORT DBMS=excel
		DATAFILE="C:\Biostat\data_chap08"
		OUT=ex.&name.&no. REPLACE;
		RANGE="exam8_&no.$";
	RUN;
%MEND;

%chap08(name=ex8_,no=16);
%chap08_2(name=ex8_,no=2a);
EXAMPLE 8.1
PROC TTEST DATA=ex.ex8_1;
	CLASS drug;
	VAR time;
RUN;
The TTEST Procedure
Variable: time (time)
| drug | Method | N | Mean | Std Dev | Std Err | Minimum | Maximum |
|---|---|---|---|---|---|---|---|
| B | 6 | 8.7500 | 0.5822 | 0.2377 | 7.9000 | 9.6000 | |
| C | 7 | 9.7429 | 0.8182 | 0.3093 | 8.7000 | 11.1000 | |
| Diff (1-2) | Pooled | -0.9929 | 0.7206 | 0.4009 | |||
| Diff (1-2) | Satterthwaite | -0.9929 | 0.3901 |
| drug | Method | Mean | 95% CL Mean | Std Dev | 95% CL Std Dev | ||
|---|---|---|---|---|---|---|---|
| B | 8.7500 | 8.1390 | 9.3610 | 0.5822 | 0.3634 | 1.4280 | |
| C | 9.7429 | 8.9861 | 10.4996 | 0.8182 | 0.5273 | 1.8018 | |
| Diff (1-2) | Pooled | -0.9929 | -1.8753 | -0.1105 | 0.7206 | 0.5105 | 1.2235 |
| Diff (1-2) | Satterthwaite | -0.9929 | -1.8543 | -0.1314 | |||
| Method | Variances | DF | t Value | Pr > |t| |
|---|---|---|---|---|
| Pooled | Equal | 11 | -2.48 | 0.0308 |
| Satterthwaite | Unequal | 10.701 | -2.55 | 0.0277 |
| Equality of Variances | ||||
|---|---|---|---|---|
| Method | Num DF | Den DF | F Value | Pr > F |
| Folded F | 6 | 5 | 1.97 | 0.4722 |
EXAMPLE 8.2
DATA data;
SET ex.ex8_2;
RUN;

PROC TTEST order=data sides=L;
	CLASS fertilizer;
	VAR height;
RUN;
The TTEST Procedure
Variable: height (height)
| fertilizer | Method | N | Mean | Std Dev | Std Err | Minimum | Maximum |
|---|---|---|---|---|---|---|---|
| present | 10 | 51.9100 | 3.3703 | 1.0658 | 47.8000 | 58.3000 | |
| newer | 8 | 56.5500 | 3.1442 | 1.1116 | 52.3000 | 61.3000 | |
| Diff (1-2) | Pooled | -4.6400 | 3.2733 | 1.5526 | |||
| Diff (1-2) | Satterthwaite | -4.6400 | 1.5400 |
| fertilizer | Method | Mean | 95% CL Mean | Std Dev | 95% CL Std Dev | ||
|---|---|---|---|---|---|---|---|
| present | 51.9100 | 49.4990 | 54.3210 | 3.3703 | 2.3182 | 6.1528 | |
| newer | 56.5500 | 53.9214 | 59.1786 | 3.1442 | 2.0788 | 6.3992 | |
| Diff (1-2) | Pooled | -4.6400 | -Infty | -1.9293 | 3.2733 | 2.4378 | 4.9817 |
| Diff (1-2) | Satterthwaite | -4.6400 | -Infty | -1.9467 | |||
| Method | Variances | DF | t Value | Pr < t |
|---|---|---|---|---|
| Pooled | Equal | 16 | -2.99 | 0.0043 |
| Satterthwaite | Unequal | 15.559 | -3.01 | 0.0042 |
| Equality of Variances | ||||
|---|---|---|---|---|
| Method | Num DF | Den DF | F Value | Pr > F |
| Folded F | 9 | 7 | 1.15 | 0.8744 |
EXAMPLE 8.2a
PROC TTEST DATA=ex.ex8_2a;
	CLASS temp;
	VAR days;
RUN;
The TTEST Procedure
Variable: days (days)
| temp | Method | N | Mean | Std Dev | Std Err | Minimum | Maximum |
|---|---|---|---|---|---|---|---|
| 10 | 8 | 46.0000 | 9.3503 | 3.3058 | 32.0000 | 59.0000 | |
| 30 | 7 | 37.4286 | 3.1015 | 1.1722 | 32.0000 | 41.0000 | |
| Diff (1-2) | Pooled | 8.5714 | 7.1775 | 3.7147 | |||
| Diff (1-2) | Satterthwaite | 8.5714 | 3.5075 |
| temp | Method | Mean | 95% CL Mean | Std Dev | 95% CL Std Dev | ||
|---|---|---|---|---|---|---|---|
| 10 | 46.0000 | 38.1829 | 53.8171 | 9.3503 | 6.1822 | 19.0305 | |
| 30 | 37.4286 | 34.5602 | 40.2969 | 3.1015 | 1.9986 | 6.8296 | |
| Diff (1-2) | Pooled | 8.5714 | 0.5463 | 16.5966 | 7.1775 | 5.2034 | 11.5633 |
| Diff (1-2) | Satterthwaite | 8.5714 | 0.5965 | 16.5464 | |||
| Method | Variances | DF | t Value | Pr > |t| |
|---|---|---|---|---|
| Pooled | Equal | 13 | 2.31 | 0.0381 |
| Satterthwaite | Unequal | 8.7104 | 2.44 | 0.0380 |
| Equality of Variances | ||||
|---|---|---|---|---|
| Method | Num DF | Den DF | F Value | Pr > F |
| Folded F | 7 | 6 | 9.09 | 0.0156 |
EXAMPLE 8.3
DATA exam8_1;
SET ex.ex8_1;
RUN;

PROC IML;
	use exam8_1; read all; close exam8_1;
    exam8_1= TableCreateFromDataSet('exam8_1');
%MACRO n(df);
	sp2=0.5193;
	t=-tinv(0.05 / 2, &df);
	d=0.50 **2;
	n=round((2*sp2*((t)*t)) / d, 1);
	print n;
%MEND n;

%n(98);
%n(32);
%n(34);

n=18;
n1=14;

n2=round(n*n1 / (2*n1-n), 1);

PRINT n2;
QUIT;
| n |
|---|
| 16 |
| n |
|---|
| 17 |
| n |
|---|
| 17 |
| n2 |
|---|
| 25 |
EXAMPLE 8.4
PROC POWER;
	TWOSAMPLEMEANS TEST=diff alpha=0.05 meandiff=0.5 stddev=0.72 power=0.90
	npergroup=. ;
RUN;

PROC IML;
    reset nolong;
	n1=45;
    n2=30;
    n=(n1*n2)/((2*n2)-n1);
    PRINT n;
RUN;
QUIT;
The POWER Procedure
Two-Sample t Test for Mean Difference
| Fixed Scenario Elements | |
|---|---|
| Distribution | Normal |
| Method | Exact |
| Alpha | 0.05 |
| Mean Difference | 0.5 |
| Standard Deviation | 0.72 |
| Nominal Power | 0.9 |
| Number of Sides | 2 |
| Null Difference | 0 |
| Computed N per Group | |
|---|---|
| Actual Power | N per Group |
| 0.903 | 45 |
| n |
|---|
| 90 |
EXAMPLE 8.5
PROC POWER;
	TWOSAMPLEMEANS TEST=diff alpha=0.05 power=0.9 npergroup=20
	stddev=0.7206 meandiff= . ;
RUN;
The POWER Procedure
Two-Sample t Test for Mean Difference
| Fixed Scenario Elements | |
|---|---|
| Distribution | Normal |
| Method | Exact |
| Alpha | 0.05 |
| Standard Deviation | 0.7206 |
| Sample Size per Group | 20 |
| Power | 0.9 |
| Number of Sides | 2 |
| Null Difference | 0 |
| Computed Mean Diff |
|---|
| Mean Diff |
| 0.758 |
EXAMPLE 8.6
PROC POWER;
	TWOSAMPLEMEANS TEST=diff alpha=0.05 power=. npergroup=15
	stddev=0.7206 meandiff=1.0 ;
RUN;
The POWER Procedure
Two-Sample t Test for Mean Difference
| Fixed Scenario Elements | |
|---|---|
| Distribution | Normal |
| Method | Exact |
| Alpha | 0.05 |
| Mean Difference | 1 |
| Standard Deviation | 0.7206 |
| Sample Size per Group | 15 |
| Number of Sides | 2 |
| Null Difference | 0 |
| Computed Power |
|---|
| Power |
| 0.956 |
EXAMPLE 8.7
PROC TTEST DATA=ex.ex8_7;
	CLASS trap;
	VAR number;
RUN;

/*공통분산 구하기*/
DATA trap1;
SET ex.ex8_7;
WHERE trap=1;
trap1=1*number;
RUN;

DATA trap2;
SET ex.ex8_7;
WHERE trap=2;
trap2=1*number;
RUN;

DATA ex8_7f;
SET trap1 trap2;
RUN;

PROC IML;
	use ex8_7f ; read all;
	v1=var(trap1)*10;
	v2=var(trap2)*9;
	sp=(v1+v2)/(10+9);
PRINT sp;
RUN;
QUIT;
The TTEST Procedure
Variable: number (number)
| trap | Method | N | Mean | Std Dev | Std Err | Minimum | Maximum |
|---|---|---|---|---|---|---|---|
| 1 | 11 | 36.4545 | 4.6768 | 1.4101 | 30.0000 | 46.0000 | |
| 2 | 10 | 57.7000 | 3.5917 | 1.1358 | 52.0000 | 64.0000 | |
| Diff (1-2) | Pooled | -21.2455 | 4.1979 | 1.8342 | |||
| Diff (1-2) | Satterthwaite | -21.2455 | 1.8106 |
| trap | Method | Mean | 95% CL Mean | Std Dev | 95% CL Std Dev | ||
|---|---|---|---|---|---|---|---|
| 1 | 36.4545 | 33.3126 | 39.5965 | 4.6768 | 3.2678 | 8.2075 | |
| 2 | 57.7000 | 55.1307 | 60.2693 | 3.5917 | 2.4705 | 6.5570 | |
| Diff (1-2) | Pooled | -21.2455 | -25.0845 | -17.4064 | 4.1979 | 3.1925 | 6.1314 |
| Diff (1-2) | Satterthwaite | -21.2455 | -25.0418 | -17.4491 | |||
| Method | Variances | DF | t Value | Pr > |t| |
|---|---|---|---|---|
| Pooled | Equal | 19 | -11.58 | <.0001 |
| Satterthwaite | Unequal | 18.522 | -11.73 | <.0001 |
| Equality of Variances | ||||
|---|---|---|---|---|
| Method | Num DF | Den DF | F Value | Pr > F |
| Folded F | 10 | 9 | 1.70 | 0.4401 |
| sp |
|---|
| 17.622488 |
EXAMPLE 8.8
PROC TTEST DATA=ex.ex8_8;
	CLASS site;
	VAR time;
RUN;

/*정규성 검정*/
PROC UNIVARIATE DATA=ex.ex8_8 normal;
	CLASS site;
	VAR time;
RUN;
The TTEST Procedure
Variable: time (time)
| site | Method | N | Mean | Std Dev | Std Err | Minimum | Maximum |
|---|---|---|---|---|---|---|---|
| 1 | 7 | 75.4143 | 3.8852 | 1.4685 | 69.3000 | 81.0000 | |
| 2 | 9 | 78.3778 | 9.3607 | 3.1202 | 64.6000 | 93.9000 | |
| Diff (1-2) | Pooled | -2.9635 | 7.5192 | 3.7893 | |||
| Diff (1-2) | Satterthwaite | -2.9635 | 3.4485 |
| site | Method | Mean | 95% CL Mean | Std Dev | 95% CL Std Dev | ||
|---|---|---|---|---|---|---|---|
| 1 | 75.4143 | 71.8211 | 79.0075 | 3.8852 | 2.5036 | 8.5555 | |
| 2 | 78.3778 | 71.1825 | 85.5730 | 9.3607 | 6.3227 | 17.9329 | |
| Diff (1-2) | Pooled | -2.9635 | -11.0908 | 5.1638 | 7.5192 | 5.5050 | 11.8586 |
| Diff (1-2) | Satterthwaite | -2.9635 | -10.5368 | 4.6098 | |||
| Method | Variances | DF | t Value | Pr > |t| |
|---|---|---|---|---|
| Pooled | Equal | 14 | -0.78 | 0.4472 |
| Satterthwaite | Unequal | 11.204 | -0.86 | 0.4082 |
| Equality of Variances | ||||
|---|---|---|---|---|
| Method | Num DF | Den DF | F Value | Pr > F |
| Folded F | 8 | 6 | 5.80 | 0.0459 |
UNIVARIATE 프로시저
변수: time (time)
site = 1
| 적률 | |||
|---|---|---|---|
| N | 7 | 가중합 | 7 |
| 평균 | 75.4142857 | 관측값 합 | 527.9 |
| 표준 편차 | 3.88519779 | 분산 | 15.0947619 |
| 왜도 | -0.1927366 | 첨도 | -0.1099754 |
| 제곱합 | 39901.77 | 수정 제곱합 | 90.5685714 |
| 변동계수 | 5.15180613 | 평균의 표준 오차 | 1.46846674 |
| 기본 통계 측도 | |||
|---|---|---|---|
| 위치측도 | 변이측도 | ||
| 평균 | 75.41429 | 표준 편차 | 3.88520 |
| 중위수 | 75.50000 | 분산 | 15.09476 |
| 최빈값 | . | 범위 | 11.70000 |
| 사분위수 범위 | 6.40000 | ||
| 위치모수 검정: Mu0=0 | ||||
|---|---|---|---|---|
| 검정 | 통계량 | p 값 | ||
| 스튜던트의 t | t | 51.3558 | Pr > |t| | <.0001 |
| 부호 | M | 3.5 | Pr >= |M| | 0.0156 |
| 부호 순위 | S | 14 | Pr >= |S| | 0.0156 |
| 정규성 검정 | ||||
|---|---|---|---|---|
| 검정 | 통계량 | p 값 | ||
| Shapiro-Wilk | W | 0.990114 | Pr < W | 0.9934 |
| Kolmogorov-Smirnov | D | 0.141352 | Pr > D | >0.1500 |
| Cramer-von Mises | W-Sq | 0.019144 | Pr > W-Sq | >0.2500 |
| Anderson-Darling | A-Sq | 0.134195 | Pr > A-Sq | >0.2500 |
| 분위수(정의 5) | |
|---|---|
| 레벨 | 분위수 |
| 100% 최댓값 | 81.0 |
| 99% | 81.0 |
| 95% | 81.0 |
| 90% | 81.0 |
| 75% Q3 | 78.7 |
| 50% 중위수 | 75.5 |
| 25% Q1 | 72.3 |
| 10% | 69.3 |
| 5% | 69.3 |
| 1% | 69.3 |
| 0% 최솟값 | 69.3 |
| 극 관측값 | |||
|---|---|---|---|
| 최소 | 최대 | ||
| 값 | 관측값 | 값 | 관측값 |
| 69.3 | 1 | 74.7 | 4 |
| 72.3 | 5 | 75.5 | 2 |
| 74.7 | 4 | 76.4 | 7 |
| 75.5 | 2 | 78.7 | 6 |
| 76.4 | 7 | 81.0 | 3 |
UNIVARIATE 프로시저
변수: time (time)
site = 2
| 적률 | |||
|---|---|---|---|
| N | 9 | 가중합 | 9 |
| 평균 | 78.3777778 | 관측값 합 | 705.4 |
| 표준 편차 | 9.3606594 | 분산 | 87.6219444 |
| 왜도 | 0.27087297 | 첨도 | -0.6762365 |
| 제곱합 | 55988.66 | 수정 제곱합 | 700.975556 |
| 변동계수 | 11.9430018 | 평균의 표준 오차 | 3.1202198 |
| 기본 통계 측도 | |||
|---|---|---|---|
| 위치측도 | 변이측도 | ||
| 평균 | 78.37778 | 표준 편차 | 9.36066 |
| 중위수 | 76.00000 | 분산 | 87.62194 |
| 최빈값 | . | 범위 | 29.30000 |
| 사분위수 범위 | 11.40000 | ||
| 위치모수 검정: Mu0=0 | ||||
|---|---|---|---|---|
| 검정 | 통계량 | p 값 | ||
| 스튜던트의 t | t | 25.11931 | Pr > |t| | <.0001 |
| 부호 | M | 4.5 | Pr >= |M| | 0.0039 |
| 부호 순위 | S | 22.5 | Pr >= |S| | 0.0039 |
| 정규성 검정 | ||||
|---|---|---|---|---|
| 검정 | 통계량 | p 값 | ||
| Shapiro-Wilk | W | 0.978589 | Pr < W | 0.9566 |
| Kolmogorov-Smirnov | D | 0.155815 | Pr > D | >0.1500 |
| Cramer-von Mises | W-Sq | 0.025996 | Pr > W-Sq | >0.2500 |
| Anderson-Darling | A-Sq | 0.159011 | Pr > A-Sq | >0.2500 |
| 분위수(정의 5) | |
|---|---|
| 레벨 | 분위수 |
| 100% 최댓값 | 93.9 |
| 99% | 93.9 |
| 95% | 93.9 |
| 90% | 93.9 |
| 75% Q3 | 84.8 |
| 50% 중위수 | 76.0 |
| 25% Q1 | 73.4 |
| 10% | 64.6 |
| 5% | 64.6 |
| 1% | 64.6 |
| 0% 최솟값 | 64.6 |
| 극 관측값 | |||
|---|---|---|---|
| 최소 | 최대 | ||
| 값 | 관측값 | 값 | 관측값 |
| 64.6 | 9 | 76.0 | 12 |
| 69.5 | 8 | 81.2 | 14 |
| 73.4 | 15 | 84.8 | 11 |
| 74.0 | 10 | 88.0 | 16 |
| 76.0 | 12 | 93.9 | 13 |
EXAMPLE 8.9
**필요값 계산**;
PROC IML;
	type1={41,35,33,36,40,46,31,37,34,30,38};
	type2={52,57,62,55,64,57,56,55,60,59};
	n1=nrow(type1);
	n2=nrow(type2);
	v1=n1-1;
	v2=n2-1;
	sum1=sum(type1);
	sum2=sum(type2);
	xbar1=round(sum1 / n1, 0.01);
	xbar2=sum2 / n2;

	xprime1=repeat(0,1,n1);
		do i=1 to n1 by 1;
		xprime1[i]=abs(type1[i]-xbar1);
		end;
	xprime2=repeat(0,1,n2);
		do i=1 to n2 by 1;
		xprime2[i]=abs(type2[i]-xbar2);
		end;
	s_xprime1=sum(xprime1);
	s_xprime2=sum(xprime2);
	xprim1=round(s_xprime1 / n1, 0.01);
	xprim2=s_xprime2 / n2;
    SS_1 = 77.25;
	SS_2 = 35.44;

	sp_prime=round((SS_1+SS_2) / (v1+v2), 0.01);
	s_differ=round(sqrt(sp_prime/n1 + sp_prime/n2), 0.01);
	t_prime=round((xprim1-xprim2) / s_differ, 0.01);
	t_19=round(-tinv(0.05 / 2, 19), 0.001);
	PRINT sp_prime s_differ t_prime t_19;
QUIT;

ods graphics off;ods exclude all;ods noresults;
PROC GLM DATA=ex.ex8_7;
	CLASS trap;
	MODEL number=trap;
	MEANS trap / hovtest=levene(type=abs);
	ods output HOVFTest=HOVFTest;
RUN;
QUIT;
ods graphics on;ods exclude none;ods results;

PROC PRINT DATA=HOVFTest;
RUN;
| sp_prime | s_differ | t_prime | t_19 |
|---|---|---|---|
| 5.93 | 1.06 | 0.71 | 2.093 |
| OBS | Effect | Dependent | Method | Source | DF | SS | MS | FValue | ProbF |
|---|---|---|---|---|---|---|---|---|---|
| 1 | trap | number | LV | trap | 1 | 2.9212 | 2.9212 | 0.49 | 0.4913 |
| 2 | trap | number | LV | Error | 19 | 112.7 | 5.9293 | _ | _ |
EXAMPLE 8.10
**필요값 계산**;
**(a)**;
PROC IML;
	weight={72.5,71.7,60.8,63.2,71.4,73.1,77.9,75.7,72.0,69.0};
	height={183.0,172.3,180.1,190.2,191.4,169.6,166.4,177.6,184.7,187.5,179.8};
	n1=nrow(weight); n2=nrow(height);
	v1=n1-1; v2=n2-1;
	sum1=sum(weight); sum2=sum(height);
	xbar1=sum1 / n1; xbar2=sum2 / n2;
	sum_squares1=sum(t(weight) * weight);
	sum_squares2=sum(t(height) * height);
    SS_1 = round(sum_squares1 - sum1**2 /n1, 0.0001);
	SS_2 = round(sum_squares2 - sum2**2 /n2, 0.0001);
	s2_1= round(SS_1 / (n1-1),0.0001);
	s2_2 = round(SS_2 / (n2-1),0.0001);
	s1=round(sqrt(s2_1), 0.01);
	s2=round(sqrt(s2_2), 0.01);
	cv1=round(s1 / xbar1, 0.0001);
	cv2=round(s2 / xbar2, 0.0001);

	logx=repeat(0,n1,1);
		DO i=1 TO n1 BY 1;
		logx[i]=round(log10(weight[i]), 0.00001);
		END;
	logy=repeat(0,n2,1);
		DO i=1 TO n2 BY 1;
		logy[i]=round(log10(height[i]), 0.00001);
		END;

	suml1=sum(logx); suml2=sum(logy);
	sum_squaresl1=sum(t(logx) * logx);
	sum_squaresl2=sum(t(logy) * logy);
    SS_logx = round(sum_squaresl1 - suml1**2 /n1, 0.000000001);
	SS_logy = round(sum_squaresl2 - suml2**2 /n2, 0.000000001);
	s_logx=round(var(logx), 0.0000001);
	s_logy=round(var(logy), 0.0000001);
	F=round(s_logx / s_logy, 0.01);
	F_2=round(quantile("F", 1-(0.05 / 2), 9,10), 0.01);


**(b)**;
	Vp=round((v1*cv1 + v2*cv2) / (v1+v2), 0.0001);
	Vp2= round(Vp**2,0.00001);
	Z=round((cv1-cv2)/sqrt(((Vp2 / v1)+(Vp2 / v2))*(0.5+Vp2)),0.01);
	Z_2=round(abs(quantile("Normal", 0.05 / 2)), 0.01);
	PRINT cv1 cv2 F F_2 Vp Vp2 Z Z_2;
QUIT;

**ttest**;
DATA weight;
SET ex.ex8_10;
IF weight =. THEN DELETE;
weight_or_height = weight;
group=1;
KEEP group weight_or_height;
RUN;

DATA height;
SET ex.ex8_10;
IF height =. THEN DELETE;
weight_or_height = height;
group=2;
KEEP group weight_or_height;
RUN;

DATA exam8_10_ttest;
SET weight height;
RUN;

ods graphics off;ods exclude all;ods noresults;
PROC TTEST DATA=exam8_10_ttest dist=lognormal;
CLASS group;
VAR weight_or_height;
ODS OUTPUT Equality = CV_test;
RUN;
ods graphics on;ods exclude none;ods results;
PROC PRINT DATA=CV_test LABEL;
RUN;
| cv1 | cv2 | F | F_2 | Vp | Vp2 | Z | Z_2 |
|---|---|---|---|---|---|---|---|
| 0.0739 | 0.0457 | 2.74 | 3.78 | 0.0591 | 0.00349 | 1.46 | 1.96 |
| OBS | Variable | Method | Numerator Degrees Freedom | Denominator Degrees Freedom | F Value | Pr > |F| |
|---|---|---|---|---|---|---|
| 1 | weight_or_height | Folded F | 9 | 10 | 2.74 | 0.1322 |
EXAMPLE 8.11
TITLE 'Example 8.11: 방법1 Wilcoxon Two-Sample Test';
%MACRO wilcoxon(data, class, var);
ods graphics off;
ods exclude all;
ods noresults;
PROC NPAR1WAY DATA=&data wilcoxon;
	EXACT wilcoxon;
	CLASS &class;
	VAR &var;
	ods output WilcoxonTest = wilcoxon_test;
RUN;
ods graphics on;
ods exclude none;
ods results;
PROC PRINT DATA=wilcoxon_test label;
RUN;
%MEND;
%wilcoxon(ex.ex8_11, sex, height);

PROC RANK DATA=ex.ex8_11 out=ex8_11_rank descending;
VAR height;
RANKS rank;
RUN;

TITLE 'Rank of male heights';
PROC PRINT DATA=ex8_11_rank;
WHERE sex=1;
RUN;

TITLE 'Rank of female heights';
PROC PRINT DATA=ex8_11_rank;
WHERE sex=2;
RUN;

TITLE 'Example 8.11: 방법2';
PROC IML;
USE ex8_11_rank;
READ all;
CLOSE ex8_11_rank;

male = loc(sex=1);
female = loc(sex=2);

n1= nrow( sex[male]);
n2= nrow( sex[female]);
R1 = sum(rank[male]);
R2 = sum(rank[female]);

U = n1*n2 + n1*(n1+1)/2 - R1;
U_prime = n1*n2 - U;

*print n1 n2 R1 R2 U U_prime;
PRINT U U_prime;
RUN;
QUIT;
| OBS | Variable | Statistic (S) | Z | Pr < Z | Pr > |Z| | t Approximation Pr < Z | t Approximation Pr > |Z| | Exact Pr <= S | Exact Pr >= |S - Mean| |
|---|---|---|---|---|---|---|---|---|---|
| 1 | height | 18.0000 | -2.2736 | 0.0115 | 0.0230 | 0.0220 | 0.0440 | 0.0088 | 0.0177 |
| OBS | sex | height | rank |
|---|---|---|---|
| 1 | 1 | 193 | 1 |
| 2 | 1 | 188 | 2 |
| 3 | 1 | 185 | 3 |
| 4 | 1 | 183 | 4 |
| 5 | 1 | 180 | 5 |
| 6 | 1 | 175 | 7 |
| 7 | 1 | 170 | 9 |
| OBS | sex | height | rank |
|---|---|---|---|
| 8 | 2 | 178 | 6 |
| 9 | 2 | 173 | 8 |
| 10 | 2 | 168 | 10 |
| 11 | 2 | 165 | 11 |
| 12 | 2 | 163 | 12 |
| U | U_prime |
|---|---|
| 32 | 3 |
EXAMPLE 8.12
title 'Example 8.12 : 방법1';
DATA ex8_12;
INPUT training speed @@;
CARDS;
1 44 1 48 1 36 1 32  1 51 1 45 1 54 1 56
2 32 2 40 2 44 2 44 2 34 2 30 2 26
;
RUN;
%wilcoxon(ex8_12, training, speed);

PROC RANK DATA=ex8_12 out=ex8_12_rank;
	VAR speed;
	RANKS rank;
RUN;

TITLE 'With training (rank in parentheses)';
PROC PRINT DATA=ex8_12_rank;
	WHERE training = 1;
RUN;

TITLE 'Without training (rank in parentheses)';
PROC PRINT DATA=ex8_12_rank;
	WHERE training = 2;
RUN;

PROC IML;
USE ex8_12_rank;
READ all;
CLOSE ex8_12_rank;
group1 = loc(training=1);
group2 = loc(training=2);

n1 = nrow(training[group1]);
n2 = nrow(training[group2]);
R1 = sum(rank[group1]);
R2 = sum(rank[group2]);

U_prime = n1*n2 + n2*(n2+1)/2 - R2;

TITLE 'Example 8.12 : 방법2';
PRINT R1 R2 U_prime ;
RUN;
QUIT;
| OBS | Variable | Statistic (S) | Z | Pr < Z | Pr > |Z| | t Approximation Pr < Z | t Approximation Pr > |Z| | Exact Pr <= S | Exact Pr >= |S - Mean| |
|---|---|---|---|---|---|---|---|---|---|
| 1 | speed | 36.5000 | -2.2087 | 0.0136 | 0.0272 | 0.0222 | 0.0444 | 0.0106 | 0.0211 |
| OBS | training | speed | rank |
|---|---|---|---|
| 1 | 1 | 44 | 9.0 |
| 2 | 1 | 48 | 12.0 |
| 3 | 1 | 36 | 6.0 |
| 4 | 1 | 32 | 3.5 |
| 5 | 1 | 51 | 13.0 |
| 6 | 1 | 45 | 11.0 |
| 7 | 1 | 54 | 14.0 |
| 8 | 1 | 56 | 15.0 |
| OBS | training | speed | rank |
|---|---|---|---|
| 9 | 2 | 32 | 3.5 |
| 10 | 2 | 40 | 7.0 |
| 11 | 2 | 44 | 9.0 |
| 12 | 2 | 44 | 9.0 |
| 13 | 2 | 34 | 5.0 |
| 14 | 2 | 30 | 2.0 |
| 15 | 2 | 26 | 1.0 |
| R1 | R2 | U_prime |
|---|---|---|
| 83.5 | 36.5 | 47.5 |
EXAMPLE 8.13
title 'Example 8.13';
PROC IML;
n1=22;
n2=46;
N = n1+n2;
U=282;

U_prime = n1*n2 - U;
mu_U = (n1*n2)/2;
sigma_U = round(sqrt((n1*n2*(N+1))/12), 0.01);
Z = round((U_prime-mu_U)/sigma_U, 0.01);
Z_criticalvalue=round(quantile('NORMAL', 1-0.05), 0.0001);
Z_pvalue = round(1-cdf('NORMAL', Z), 0.0001);

*print U U_prime mu_U sigma_U ;
PRINT Z Z_criticalvalue Z_pvalue;
RUN;
QUIT;
| Z | Z_criticalvalue | Z_pvalue |
|---|---|---|
| 2.94 | 1.6449 | 0.0016 |
EXAMPLE 8.14
title 'Example 8.14 : 방법1';
DATA exam8_14;
INPUT assistant rank @@;
CARDS;
1 3 1 3 1 3 1 6 1 10 1 10 1 13.5 1 13.5 1 16.5 1 16.5 1 19.5
2 3 2 3 2 7.5 2 7.5 2 10 2 12 2 16.5 2 16.5 2 19.5 2 22.5 2 22.5 2 22.5 2 22.5 2 25
;
RUN;
%wilcoxon(exam8_14, assistant, rank);
| OBS | Variable | Statistic (S) | Z | Pr < Z | Pr > |Z| | t Approximation Pr < Z | t Approximation Pr > |Z| | Exact Pr <= S | Exact Pr >= |S - Mean| |
|---|---|---|---|---|---|---|---|---|---|
| 1 | rank | 114.5000 | -1.5469 | 0.0609 | 0.1219 | 0.0675 | 0.1350 | 0.0604 | 0.1213 |
EXAMPLE 8.15
DATA ex8_15;
INPUT group $ sample x @@;
CARDS;
a 1 6 a 2 6 n 1 3 n 2 8
;
RUN;

DATA  data;
SET  ex8_15;
RUN;

PROC FREQ order=data;
	WEIGHT x;
	TABLE group*sample/expected chisq;
RUN;
FREQ 프로시저
|
| ||||||||||||||||||||||||
group * sample 테이블에 대한 통계량
| 통계량 | 자유도 | 값 | Prob |
|---|---|---|---|
| WARNING: 50%개의 셀이 5보다 적은 기대빈도를 가지고 있습니다. 카이제곱 검정은 올바르지 않을 수 있습니다. | |||
| 카이제곱 | 1 | 1.2446 | 0.2646 |
| 우도비 카이제곱 | 1 | 1.2626 | 0.2612 |
| 연속성 수정 카이제곱 | 1 | 0.4733 | 0.4915 |
| Mantel-Haenszel 카이제곱 | 1 | 1.1905 | 0.2752 |
| 파이 계수 | 0.2326 | ||
| 우발성 계수 | 0.2266 | ||
| 크래머의 V | 0.2326 | ||
| Fisher의 정확 검정 | |
|---|---|
| (1,1) 셀 빈도(F) | 6 |
| 하단측 p값 Pr <= F | 0.9398 |
| 상단측 p값 Pr >= F | 0.2468 |
| 테이블 확률 (P) | 0.1866 |
| 양측 p값 Pr <= P | 0.4003 |
표본 크기 = 23
EXAMPLE 8.16
PROC IML;
	RESET nolog;
	michigan={47, 35, 7,5,3,2};
	m_log=michigan#(log10(michigan));
	m_log2=michigan#(log10(michigan)) # (log10(michigan));

	louisiana={48,23,11,13,8,2};
	lou_log=louisiana#(log10(louisiana));
	lou_log2=louisiana#(log10(louisiana)) # (log10(louisiana));

	sh1=((sum(m_log2))-((sum(m_log))**2)/sum(michigan))/sum(michigan)**2;
	sh2=((sum(lou_log2))-((sum(lou_log))**2)/sum(louisiana))/sum(louisiana)**2;

	sh_f=sh1+sh2;
	sh_ff=sqrt(sh1+sh2);

	t=(0.5403-0.6328)/sh_ff;

	v=((sh_f)**2)/((((sh1)**2)/99)+(((sh2)**2)/105));

	p=probt(-1.911, v)*2;

	PRINT sh_ff  v p;

RUN;
QUIT;
| sh_ff | v | p |
|---|---|---|
| 0.0484277 | 195.92776 | 0.0574643 |
교재: Biostatistical Analysis (5th Edition) by Jerrold H. Zar
**이 글은 22학년도 1학기 의학통계방법론 과제 자료들을 정리한 글 입니다.**
