[의학통계방법론] Ch7. One-Sample Hypotheses
One-Sample Hypotheses
R 프로그램 결과
R 접기/펼치기 버튼
패키지 설치된 패키지 접기/펼치기 버튼
getwd()
## [1] "C:/Biostat"
library("dplyr")
library("kableExtra")
library("readxl")
library("pwr")
library("PairedData")
엑셀파일불러오기
#모든 시트를 하나의 리스트로 불러오는 함수
read_excel_allsheets <- function(file, tibble = FALSE) {
  sheets <- readxl::excel_sheets(file)
  x <- lapply(sheets, function(X) readxl::read_excel(file, sheet = X))
  if(!tibble) x <- lapply(x, as.data.frame)
  names(x) <- sheets
  x
}
7장
7장 연습문제 불러오기
#data_chap07에 연습문제 7장 모든 문제 저장
data_chap07 <- read_excel_allsheets("data_chap07.xls")

#연습문제 각각 데이터 생성
for (x in 1:length(data_chap07)){
  assign(paste0('ex7_',c(1:4,13))[x],data_chap07[x])
  }

#연습문제 데이터 형식을 리스트에서 데이터프레임으로 변환
for (x in 1:length(data_chap07)){
  assign(paste0('ex7_',c(1:4,13))[x],data.frame(data_chap07[x]))
  }
EXAMPLE 7.1

#데이터셋
ex7_1
##    Temperature
## 1         24.3
## 2         25.8
## 3         24.6
## 4         26.1
## 5         22.9
## 6         25.1
## 7         27.3
## 8         24.0
## 9         24.5
## 10        23.9
## 11        26.2
## 12        24.3
## 13        24.6
## 14        23.3
## 15        25.5
## 16        28.1
## 17        24.8
## 18        23.5
## 19        26.3
## 20        25.4
## 21        25.5
## 22        23.9
## 23        27.0
## 24        24.8
## 25        22.9
## 26        25.4
- 해당 데이터는 조간 생태계에 서식하는 게의 온도를 측정한 자료이다.
- 조간 생태계의 게의 온도의 평균이 24.3℃ 인지 t검정을 해보려 한다.
- 1) 24.3 데이터가 잘못 들어가 있으므로 제거하여 준다.
ex7_1 <- ex7_1$Temperature[2:26] #잘못 기입된 데이터로 인하여 수정
다음은 R 내장 함수로 구한 t-value이다.
t.test(ex7_1,alternative = c("two.sided"),mu=24.3,conf.level = 0.95)
##
##  One Sample t-test
##
## data:  ex7_1
## t = 2.7128, df = 24, p-value = 0.01215
## alternative hypothesis: true mean is not equal to 24.3
## 95 percent confidence interval:
##  24.47413 25.58187
## sample estimates:
## mean of x
##    25.028
- t-value가 문제와 다르게 나온 것을 볼 수 있다.
직접 함수를 작성해서 구하여 보자.
two_tailed_t_test <- function(x,mu){
  n <- length(x)
  mu <- mu
  xbar <- round(mean(x),2)
  s2 <- round(var(x),2)
  se <- round(sqrt(s2/n),2)
  original_t <- ((mean(x)-mu)/sqrt(var(x)/n))
  t <- round((xbar-mu)/se,3)
  df <- n-1
  alpha <- 0.05
  value <- round(qt(1-(alpha/2),df),3)
  if(t>0){pvalue=2*pt(t,df,lower.tail=F)}
  else{pvalue=2*pt(t,df,lower.tail=T)}
  out <- data.frame(n=n,alpha=alpha,mu=mu,mean=xbar,var=s2,std_err=se,t_statistic=t,original_t=round(original_t,4),df=df,value=value,p_value=round(pvalue,3))
  return(out)
}

two_tailed_t_test(x=ex7_1,mu=24.3)
##    n alpha   mu  mean var std_err t_statistic original_t df value p_value
## 1 25  0.05 24.3 25.03 1.8    0.27       2.704     2.7128 24 2.064   0.012
- 값이 다르게 나온 이유는 반올림의 문제로 보인다.
- t검정 결과를 확인하여 보면 p-value가 0.012로 유의수준 0.05하에 귀무가설을 기각한다.
- 그러므로 조간 생태계의 게의 모평균 온도는 24.3℃가 아니라고 할 수 있다.
t <- two_tailed_t_test(ex7_1,mu=24.3)$value
curve(dt(x,24),-3,3,xlab="t",ylab="Density",yaxt='n',main="Hypothesis in Example 7.1 (df=24)")
polygon(c(t,seq(t,3,0.001),t),
        c(dt(-3,24),dt(seq(t,3,0.001),24),dt(-3,24)),col="#007266",density=30)
polygon(c(-3,seq(-3,-t,0.001),-t),
        c(dt(-3,24),dt(seq(-3,-t,0.001),24),dt(-3,24)),col="#007266",density = 30)
text(x=-2.064,y=0.1,labels = "-2.064")
text(x=2.064,y=0.1,labels = "2.064")

위 그림은 기각역을 그래프로 표현하였다.
t <- seq(-4, 4,0.01)
v1 <- 2
v2 <- 4
v3 <- 50
y1 <-(1/sqrt(pi*v1))*(factorial((v1+1)/2-1)/factorial(v1/2-1))*(1+t^2/v1)^(-(v1+1)/2)
y2 <-(1/sqrt(pi*v2))*(factorial((v2+1)/2-1)/factorial(v2/2-1))*(1+t^2/v2)^(-(v2+1)/2)
y3 <-(1/sqrt(pi*v3))*(factorial((v3+1)/2-1)/factorial(v3/2-1))*(1+t^2/v3)^(-(v3+1)/2)
plot(t, y1, type = 'l', col = 'red',xlab = "t",ylab = "Density", yaxt='n',ylim=c(0,0.4))
lines(t, y2, type = 'l', lty=2, col = 'blue')
lines(t, y3, type = 'l', lty=2, col = 'darkgreen')
legend("topright",legend=c("ν=1","ν=2","ν=50"),fil=c("red","blue","darkgreen"))

위 그림은 자유도에 따른 t-분포 그래프의 변화이다.
EXAMPLE 7.2

#데이터셋
ex7_2
##    weightchange
## 1           1.7
## 2           0.7
## 3          -0.4
## 4          -1.8
## 5           0.2
## 6           0.9
## 7          -1.2
## 8          -0.9
## 9          -1.8
## 10         -1.4
## 11         -1.8
## 12         -2.0
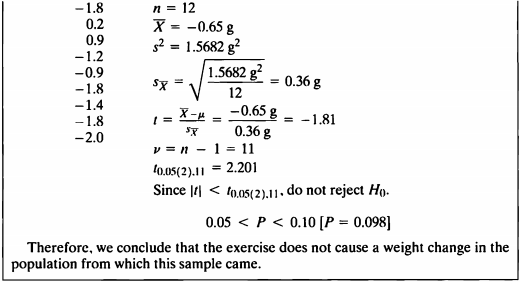
- 해당 데이터는 운동 후의 몸무게의 변화량을 측정한 자료이다.
- 운동 후 몸무게의 변화량의 모평균이 0인지 검정하기 위해 t 검정을 수행한다.
t.test(ex7_2$weightchange, mu=0, alternative = "two.sided")
##
##  One Sample t-test
##
## data:  ex7_2$weightchange
## t = -1.7981, df = 11, p-value = 0.09964
## alternative hypothesis: true mean is not equal to 0
## 95 percent confidence interval:
##  -1.4456548  0.1456548
## sample estimates:
## mean of x
##     -0.65
two_tailed_t_test(ex7_2$weightchange,mu=0)
##    n alpha mu  mean  var std_err t_statistic original_t df value p_value
## 1 12  0.05  0 -0.65 1.57    0.36      -1.806    -1.7981 11 2.201   0.098
- t 검정 결과를 확인하여 보면 p-value가 0.098로 유의수준 0.05하에 귀무가설을 기각할 수 없다.
- 그러므로 운동으로 인한 변화량의 모평균은 0이 아니라고 할 수 없다.
t <- two_tailed_t_test(ex7_2$weightchange,mu=0)$value
curve(dt(x,11),-3,3,xlab="t",ylab="Density",yaxt='n',main="Hypothesis in Example 7.2 (df=11)")
polygon(c(t,seq(t,3,0.001),t),
        c(dt(-3,11),dt(seq(t,3,0.001),11),dt(-3,11)),col="#007266",density=30)
polygon(c(-3,seq(-3,-t,0.001),-t),
        c(dt(-3,11),dt(seq(-3,-t,0.001),11),dt(-3,11)),col="#007266",density = 30)
text(x=-2.201,y=0.1,labels = "-2.201")
text(x=2.201,y=0.1,labels = "2.201")

위 그림은 기각역을 그래프로 표현하였다.
EXAMPLE 7.3

#데이터셋
ex7_3
##    weightchange
## 1           0.2
## 2          -0.5
## 3          -1.3
## 4          -1.6
## 5          -0.7
## 6           0.4
## 7          -0.1
## 8           0.0
## 9          -0.6
## 10         -1.1
## 11         -1.2
## 12         -0.8
- 해당 데이터는 약물을 복용 후 몸무게의 증감이 있는지를 기록한 자료이다.
- 약물 복용 후 몸무게의 증감의 모평균이 0보다 큰지 아닌지 알아보기 위해 t 검정을 수행한다.
다음은 R 내장 함수로 구한 단측 검정이다.
t.test(ex7_3, alternative = c("less"), mu=0, conf.level = 0.95)
##
##  One Sample t-test
##
## data:  ex7_3
## t = -3.3285, df = 11, p-value = 0.003364
## alternative hypothesis: true mean is less than 0
## 95 percent confidence interval:
##        -Inf -0.2801098
## sample estimates:
##  mean of x
## -0.6083333
직접 함수를 작성해서 구하여 보자.
one_tailed_t_test <- function(x,mu){
  n <- length(x)
  mu <- mu
  xbar <- round(mean(x),2)
  s2 <- round(var(x),2)
  se <- round(sqrt(s2/n),2)
  original_t <- ((mean(x)-mu)/sqrt(var(x)/n))
  t <- round((xbar-mu)/se,3)
  df <- n-1
  alpha <- 0.05
  value <- round(qt(1-(alpha),df),3)
  if(t>0){pvalue=pt(t,df,lower.tail=F)}
  else{pvalue=pt(t,df,lower.tail=T)}
  out <- data.frame(n=n,alpha=alpha,mu=mu,mean=xbar,var=s2,std_err=se,t_statistic=t,original_t=round(original_t,4),df=df,value=value,p_value=round(pvalue,3))
  return(out)
}

one_tailed_t_test(ex7_3$weightchange,mu=0)
##    n alpha mu  mean var std_err t_statistic original_t df value p_value
## 1 12  0.05  0 -0.61 0.4    0.18      -3.389    -3.3285 11 1.796   0.003
- t 검정 결과를 확인하여 보면 t 검정통계량값은 -3.3285 이며,
p-value는 0.003로 유의수준 0.05하에 귀무가설을 기각할 수 있다. - 따라서 살을 빼기 위한 목적으로의 약을 복용했을 때 몸무게의 변화량의 모평균이 0이 아니라고 할 수 있다.
t <- one_tailed_t_test(ex7_3$weightchange,mu=0)$value
curve(dt(x,11),-3,3,xlab="t",ylab="Density",yaxt='n',main="Hypothesis in Example 7.3 (df=11)")
polygon(c(-3,seq(-3,-t,0.001),-t),
        c(dt(-3,11),dt(seq(-3,-t,0.001),11),dt(-3,11)),col="#007266",density = 30)
text(x=-1.796,y=0.12,labels = "-1.796")

위 그림은 기각역을 그린 t 분포이다.
EXAMPLE 7.4

#데이터셋
ex7_4
##   gastricjuice
## 1         42.7
## 2         43.4
## 3         44.6
## 4         45.1
## 5         45.6
## 6         45.9
## 7         46.8
## 8         47.6
- 해당 데이터는 약물이 위액에 용해시간을 측정한 자료로써,
용해 시간의 평균이 45초보다 낮은지 아닌지를 검정하기 위해 t 검정을 수행한다.
t.test(ex7_4$gastricjuice,mu=45,alternative = "greater")
##
##  One Sample t-test
##
## data:  ex7_4$gastricjuice
## t = 0.36647, df = 7, p-value = 0.3624
## alternative hypothesis: true mean is greater than 45
## 95 percent confidence interval:
##  44.11393      Inf
## sample estimates:
## mean of x
##   45.2125
one_tailed_t_test(ex7_4$gastricjuice,mu=45)
##   n alpha mu  mean  var std_err t_statistic original_t df value p_value
## 1 8  0.05 45 45.21 2.69    0.58       0.362     0.3665  7 1.895   0.364
- t 검정 결과를 확인하여 보면 t 검정통계량값은 0.362 이며,
p-value는 0.364로 유의수준 0.05하에 귀무가설을 기각할 수 없다. - 그러므로 약물이 위액에 용해되는 시간의 모평균이 45초보다 크다고 할 수 없다.
t <- one_tailed_t_test(ex7_4$gastricjuice,mu=45)$value
curve(dt(x,7),-3,3,xlab="t",ylab="Density",yaxt='n',main="Hypothesis in Example 7.4 (df=7)")
polygon(c(t,seq(t,3,0.001),t),
        c(dt(-3,7),dt(seq(t,3,0.001),7),dt(-3,7)),col="#007266",density=30)
text(x=1.895,y=0.12,labels = "1.895")

위 그림은 기각역을 그린 t 분포이다.
EXAMPLE 7.5

t.test(ex7_1,alternative = c("two.sided"),conf.level = 0.95)
##
##  One Sample t-test
##
## data:  ex7_1
## t = 93.263, df = 24, p-value < 2.2e-16
## alternative hypothesis: true mean is not equal to 0
## 95 percent confidence interval:
##  24.47413 25.58187
## sample estimates:
## mean of x
##    25.028
t.test(ex7_1,alternative = c("two.sided"),conf.level = 0.99)
##
##  One Sample t-test
##
## data:  ex7_1
## t = 93.263, df = 24, p-value < 2.2e-16
## alternative hypothesis: true mean is not equal to 0
## 99 percent confidence interval:
##  24.27741 25.77859
## sample estimates:
## mean of x
##    25.028
- 95% 신뢰구간이란 100번의 표본추출을 통해 각각의 신뢰구간을 구했을 때
실제 모집단의 평균이 그 안에 포함될 경우가 95번 정도임을 말하며, - 99% 신뢰구간이란 100번의 표본추출을 통해 각각의 신뢰구간을 구했을 때
실제 모집단의 평균이 그 안에 포함될 경우가 99번 정도임을 말한다. - 이를 바탕으로 추론해볼 수 있는 사실은 신뢰구간이 넓어질수록
그 신뢰구간이 모평균을 포함하는 경우의 수가 많아질 것이라고 예측해볼 수 있으며
이는 실제 위의 95%, 99% 신뢰구간을 통해 확인할 수 있다. - 95% 신뢰구간은 mu=24.3를 포함하지 않으나,
매우 작은 값으로 CI에 포함되지 않는 것이기에 샘플 규모를 키우면 CI에 포함될 가능성이 있다. - 즉, 95%, 99% CI 모두 mu=24.3 포함하는 것으로 해석하여 귀무가설은 기각하지 못한다.
- 따라서 체온 변화의 모평균은 24.3도가 아니라고 할 수 없다.
EXAMPLE 7.6
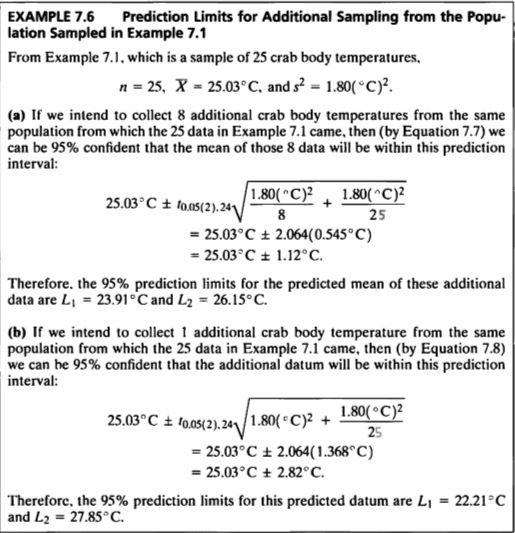
- Example 7.1 데이터에 게를 추가하여 예측구간을 구하여 보겠다.
다음은 8개의 추가 데이터가 생길 때의 모평균의 예측구간을 나타낸다.
n <- length(ex7_1)
M <- mean(ex7_1)
V <- var(ex7_1)
SR <- sqrt((V/8)+(V/25))
a = 1-(0.05/2)

L <- M-(qt(a, df=n-1)*SR)
R <- M+(qt(a, df=n-1)*SR)
cat(" Mean = ",M,"℃","\n","Std.Err = ",SR,"℃","\n", "df = ",n-1,"\n","95% confidence interval = [",round(L,2),",",round(R,2),"]")
##  Mean =  25.028 ℃
##  Std.Err =  0.5450427 ℃
##  df =  24
##  95% confidence interval = [ 23.9 , 26.15 ]
이번엔 1개의 추가 데이터가 생길 때의 모평균의 예측구간을 확인하여 보자.
n <- length(ex7_1)
M <- mean(ex7_1)
V <- var(ex7_1)
SR <- sqrt((V/1)+(V/25))
a = 1-(0.05/2)

L <- M-(qt(a, df=n-1)*SR)
R <- M+(qt(a, df=n-1)*SR)
cat(" Mean = ",M,"℃","\n","Std.Err = ",SR,"℃","\n", "df = ",n-1,"\n","95% confidence interval = [",round(L,2),",",round(R,2),"]")
##  Mean =  25.028 ℃
##  Std.Err =  1.368375 ℃
##  df =  24
##  95% confidence interval = [ 22.2 , 27.85 ]
| Number of Added sample | L1 | L2 |
|---|---|---|
| 8 | 23.91 | 26.15 |
| 1 | 22.21 | 27.85 |
- m=8일 때 예측구간은 (23.91, 26.15)이고 m=1일 때 예측구간은 (22.21, 27.85)이다.
- 이를 보면 관측치가 많아질 수록 신뢰구간이 짧아지는 것을 확인할 수 있다.
EXAMPLE 7.7
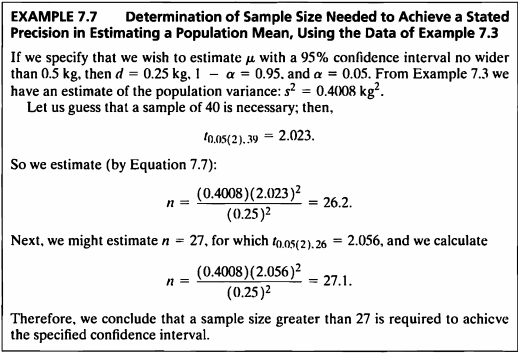
- 95% 신뢰구간의 길이가 0.5보다 길지 않도록 하려면
d=0.25, α=0.05로 설정해야 하고, Example7_3을 통해 구한 분산은 0.4008이다. - 정규분포를 따르는 표본의 분산을 구할 수 있다면
원하는 정밀도에 필요한 표본 크기를 다음의 식을 통하여 추정할 수 있다.
- 하지만 이 공식에서 우리는 자유도 값을 모르기 때문에 (표본 크기를 모르기 때문)
반복적인 과정을 통해서 가정한 n값과 실제 결과로 나온 표본의 크기가 가장 잘 일치하는 값을 찾아야 한다. - 우선 Example 7.3의 데이터를 사용하여 n=40부터 대입하여 보자.
ceiling() 함수를 사용하여 나온 결과보다 크거나 같은 정수를 나오게 하였다.
d=0.25
a = 1-(0.05/2)

n1 <- ceiling((var(ex7_3$weightchange)*(qt(0.975, df=40-1))^2)/d^2) # n=40
cat(" nessesary sample size = 40, n = ",n1)
## nessesary sample size = 40, n = 27
- 최대정밀도가 0.25이고 표본 40개 필요하다고 했을 때 n=27로 27보다 커야하므로 n=27을 다시 대입하여 보자.
n2 <- ceiling((var(ex7_3$weightchange)*(qt(0.975, df=27-1))^2)/d^2) # n=27
cat("nessesary sample size = 27, n = ",n2)
## nessesary sample size = 27, n = 28
- 표본이 27일 때에는 n=28로 specific 한 신뢰구간을 얻기 위해서는 28 이상의 표본이 필요하다.
EXAMPLE 7.8
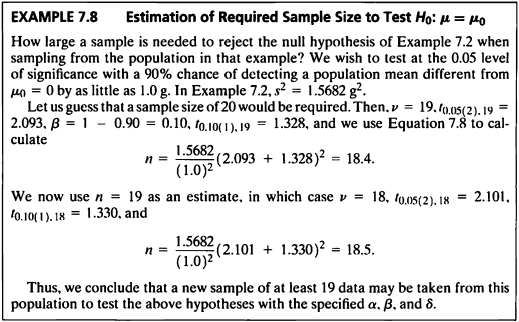
- Example 7.2 데이터를 사용해서 귀무가설 \(H_0: \mu \ = \mu_0\) 를 기각할 수 있는 최소 표본크기를 계산해보도록한다.
- \(\alpha=0.05,\ \beta=0.10,\ \delta =1.0\) 가 주어져 있다고 하자. Example 7.2의 \(s^2=1.5682\) 이다.
\[\begin{aligned} n=\frac{s^2}{\delta^2}(t_{\alpha,\nu}\ +\ t_{\beta (1), \nu})^2 \end{aligned}\]샘플 사이즈를 구하는 공식은 다음과 같다.
먼저 샘플 사이즈가 20이 필요하다고 가정하면 다음과 같다.
d<-1.0
var<-round(var(ex7_2$weightchange),4)
t005<-round(qt(0.025, df=19, lower.tail=F),3)
t01<-round(qt(0.1, df=19, lower.tail=F),3)
n1 <- round((var/(d)^2)*(t005+t01)^2,1)
n1
## [1] 18.4
이제 추정에 필요한 샘플 사이즈가 19라고 하자.
d<-1.0
var<-round(var(ex7_2$weightchange),4)
t005<-round(qt(0.025, df=18, lower.tail=F),3)
t01<-round(qt(0.1, df=18, lower.tail=F),3)
n2 <- round((var/(d)^2)*(t005+t01)^2,1)
n2
## [1] 18.5
cat(" sample size가 20 일때 필요한 최소 표본수 =",ceiling(n1),"\n","sample size가 19 일때 필요한 최소 표본수 =", ceiling(n2))
##  sample size가 20 일때 필요한 최소 표본수 = 19
##  sample size가 19 일때 필요한 최소 표본수 = 19
- 샘플 사이즈를 처음에는 20으로 했었고 19로도 해본 결과,
최소로 필요한 표본의 수는 각각 18.4와 18.5로 산출되었다. - 그러므로 \(\alpha=0.05,\ \beta=0.10,\ \delta =1.0\) 로 주어졌을 때,
귀무가설 \(H_0 : \mu_0 = \mu\)을 기각할 필요한 최소의 표본수는 19개이다.
pwr.t.test() 함수를 사용했을 때에도 같은 결과가 나온다.
library(pwr)

dd <- 1/sqrt(var(ex7_2$weightchange)) #effect size

pwr.t.test(n=,d=dd, sig.level=0.05, power=0.90, type="one.sample")
##
##      One-sample t test power calculation
##
##               n = 18.5056
##               d = 0.7985494
##       sig.level = 0.05
##           power = 0.9
##     alternative = two.sided
EXAMPLE 7.9
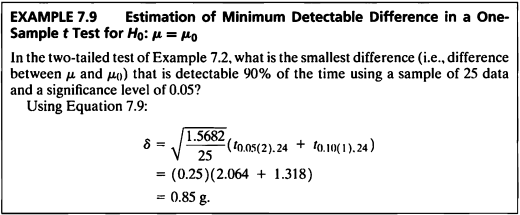
- Example 7.8에서는 양측 t-test를 검정할 때 smallest difference 인 \(\delta\)를 알고 있었다.
- 만약 \(\delta\) 가 주어져 있지 않고 \(n\)만 주어져있을 때 \(\delta\) 를 구하는 과정은 다음과 같다.
p<-pwr.t.test(n=25, sig.level = 0.05, power=0.90, type="one.sample", alternative="two.sided")

(p$d)*sd(ex7_2$weightchange)
## [1] 0.8464156
- 그러므로 표본수가 25, 유의수준 0.05, 검정력이 0.9일 때 최소 유의차는 양측검정에서 0.85이다.
EXAMPLE 7.10
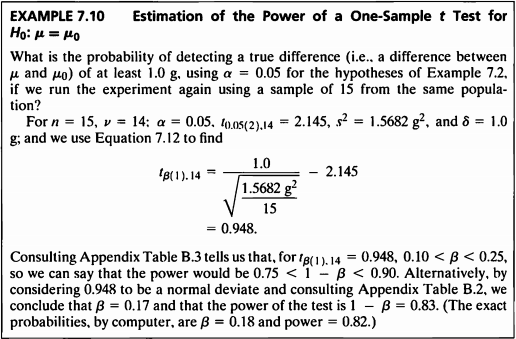
- 이 예제의 경우 가설 \(H_0 : \mu =0\)에 대한 t-test의 검정력을 추정하는 문제로
아래와 같은 식을 통해 β값을 찾을 수 있다.
- 주어진 조건(\(n=15,\ \nu=14,\ \alpha=0.05,\ t_{0.05(2),14}=2.145,\ s^2=1.5682,\ \delta=1.0\))을 대입하여
\(t_{β(1),14}\) 값을 구해보면 0.948이 나오고 이를 바탕으로 t분포표를 이용해 β값을 구해낼 수 있다.
n <- 15
var <- round(var(ex7_2$weightchange),4)
t005 <- round(qt(0.025, df=14, lower.tail=F),3)
beta<-round(1.0/(sqrt(var/n))-t005,3)
beta
## [1] 0.948
- t분포표에서 찾아보면 0.948 값은 df=14일 때 α=0.1과 α=0.25 사이에 있는 값임을 확인할 수 있다.
이를 pwr.t.test() 함수를 사용해서 구해보면 다음과 같다.
pwr.t.test(n=15, d=1, sig.level = 0.05, power=, type="one.sample")
##
##      One-sample t test power calculation
##
##               n = 15
##               d = 1
##       sig.level = 0.05
##           power = 0.9490865
##     alternative = two.sided
\(\delta=1.0\)이 아닌 계산을 통한 정확한 값은 다음과 같다.
d <- 1/sqrt(var(ex7_2$weightchange)) #exact effect size
pwr_test<-pwr.t.test(n=15,d=d, sig.level=0.05, power=, type="one.sample", alternative="two.sided")
round(pwr_test$power,2)
## [1] 0.82
- pwr.test결과에서 좀 더 정확한 검정력을 보면 power=0.82로써 1-power=0.18임을 알 수 있고
따라서 β=0.18임을 알 수 있다.
EXAMPLE 7.11


one_tailed_chi2_test <- function(x,sig,up_or_down){
  n <- length(x)
  sig <- sig
  df <- n-1
  ss <- round(var(x)*df,4)
  s2 <- round(var(x),4)
  chis <- round(ss/sig,3)
  df <- n-1
  alpha <- 0.05
  if (up_or_down == "up"){chi2 = round(qchisq((1-alpha),df),3) }
  else { chi2 = round(qchisq((alpha),df),3)}
  if(chis < chi2){decision="Not reject H0"}
  else{decision="Reject H0"}
  out <- data.frame(SS=ss,df,s2,chis,chi2,decision)
  return(out)
}

one_tailed_chi2_test(ex7_4$gastricjuice,1.5,up_or_down = "up")%>%
  kbl(caption = "Result of Hypothesis") %>%
  kable_styling(bootstrap_options = c("striped", "hover", "condensed", "responsive"))
| SS | df | s2 | chis | chi2 | decision |
|---|---|---|---|---|---|
| 18.8287 | 7 | 2.6898 | 12.552 | 14.067 | Not reject H0 |
- 가설 검정 결과 \(SS=18.8281\) 이고 카이제곱 검정통계량 \(\chi^2=12.552\) 이며,
유의수준 0.05 아래에서 검정통계량 값이 기각역인 \(\chi_{0.05,7}^2=14.067\) 에 포함되지 않아
귀무가설 \(H_0 : \sigma^2 \leq 1.5\ sec^2\) 를 기각할 수 없다.
다음은 PairedTest 패키지에 있는 Var.test를 통해 가설검정을 수행한 결과이다.
library(PairedData)
Var.test(ex7_4$gastricjuice,ratio=1.5,alternative = "greater")
##
##  One-sample variance test
##
## data:  x
## X-squared = 12.552, df = 7, p-value = 0.08379
## alternative hypothesis: true variance is greater than 1.5
## 95 percent confidence interval:
##  1.338492      Inf
## sample estimates:
## variance
## 2.689821
- 위의 결과에서 p-value=0.08379로 유의수준 0.05보다 커서 귀무가설을 기각할 수 없다.
- 그러므로 해당 데이터의 모분산이 1.5 sec2 보다 크다는 증거가 부족하다.
c <- one_tailed_chi2_test(ex7_4$gastricjuice,1.5,up_or_down = "up")$chi2
cc <- one_tailed_chi2_test(ex7_4$gastricjuice,1.5,up_or_down = "up")$chis
curve(dchisq(x,7),0,25,xlab=expression(chi^2),ylab="",yaxt='n',main="Hypothesis in Example 7.11 (df=7)")
polygon(c(cc,seq(cc,25,0.001),cc), #기각역
        c(dchisq(0,7),dchisq(seq(cc,25,0.001),7),dchisq(0,25)),col="#007266",density=30)
polygon(c(c,seq(c,25,0.001),c),
        c(dchisq(0,7),dchisq(seq(c,25,0.001),7),dchisq(0,25)),col="#ffffb3",density=30)
# polygon(c(-3,seq(-3,-t,0.001),-t),
#         c(dt(-3,24),dt(seq(-3,-t,0.001),24),dt(-3,24)),col="deeppink",density = 30)
text(x=14.067,y=0.025,labels = "14.067")
text(x=12.552,y=0.036,labels = "12.552")
text(x=20, y=0.1, expression(chi^2 == paste(frac(SS, sigma[0]^2), " ",)), cex = 1.5)

위 그림은 기각역을 그린 카이제곱 분포이다.
EXAMPLE 7.12
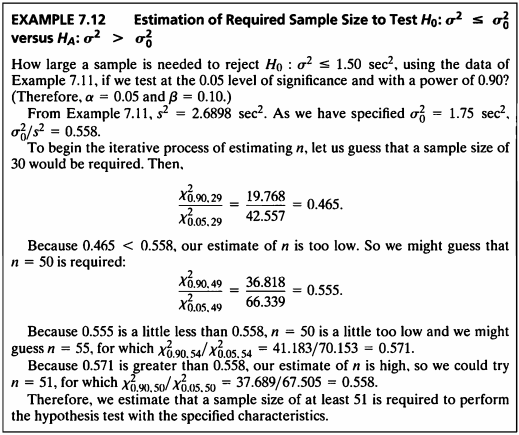
- 앞의 예제에서는 Example 7.4데이터를 이용하여 모분산에 대한 가설검정을 하였다.
그렇다면 유의수준 5% 하에서 0.90의 검정력을 가지고
귀무가설 \(H_0 : \sigma^2 \leq 1.50\ sec^2\) 을 기각하기 위해서는
얼만큼의 표본이 필요할지 Sample size를 구해보도록 한다. - Example 7.4에서 해당 데이터의 \(s^2=2.6898\ sec^2\)을 알고있다.
- 모분산 \(\sigma_0^2=1.75\ sec^2\) 를 알고있다고 가정하면 \(\frac{\sigma_0^2}{s^2}=0.558\) 임을 알 수 있다.
\[\begin{aligned} \frac{\chi_{1-\beta, \nu}^2}{\chi_{\alpha, \nu}^2}=\frac{\sigma_0^2}{s^2} \end{aligned}\]\(\alpha=0.05,\ 1-\beta=0.90\) 으로 주어져 있을 때 필요한 최소의 표본수를 구하는 공식은 다음과 같다.
- Example 7.11에 따르면 \(s^2\)=2.6898이고, \(\sigma_0^2\)=1.75 \(sec^2\) 이므로 \(\frac{\sigma_0^2}{s^2}=0.558\)이다.
\[\begin{aligned} \frac{\chi_{0.90,29}^2}{\chi_{0.05,29}^2}= \frac{19.768}{42.557}=0.465 \end{aligned}\]위 식을 만족하기 위한 n을 찾기 위해 먼저 n=30 을 가정하고 좌변을 계산해보면 다음과 같다.
alpha<-0.05
beta<-0.1
n1<-30
chi_1<-round(qchisq((beta),(n1-1)),3)
chi_2<-round(qchisq((1-alpha),(n1-1)),3)
cat("If n=30, ratio =",ratio<-round(chi_1/chi_2,3))
## If n=30, ratio = 0.465
- 0.456 < 0.558 이므로 가정했던 n값 30이 너무 작다는 것을 알 수 있다.
\[\begin{aligned} \frac{\chi_{0.90,49}^2}{\chi_{0.05,49}^2}= \frac{36.818}{66.339}=0.555 \end{aligned}\]따라서 n=50 으로 가정하여 다시 좌변을 계산해보면 다음과 같다.
n2<-50
chi_1<-round(qchisq((beta),(n2-1)),3)
chi_2<-round(qchisq((1-alpha),(n2-1)),3)
cat("If n=50, ratio =",ratio<-round(chi_1/chi_2,3))
## If n=50, ratio = 0.555
- 0.555 역시 0.558 보다는 약간 작은 수치이므로 n을 더 키워서 계산하여 보자.
\[\begin{aligned} \frac{\chi_{0.90,54}^2}{\chi_{0.05,54}^2}= \frac{41.183}{70.153}=0.571 \end{aligned}\]n=55 로 가정하여 다시 좌변을 계산해보면 다음과 같다.
n3<-55
chi_1<-round(qchisq((beta),(n3-1)),3)
chi_2<-round(qchisq((1-alpha),(n3-1)),3)
cat("If n=55, ratio =",ratio<-round(chi_1/chi_2,3))
## If n=55, ratio = 0.571
- 하지만 이 경우 ratio값이 0.571로 0.558 보다 커졌기 때문에
다시 n=51 로 가정하고 다시 좌변을 계산해보면 0.558과 일치하는 것을 볼 수 있다.
n4 <- 51
chi_1 <- round(qchisq(beta,n4-1), 3)
chi_2 <- round(qchisq(1-alpha, n4-1), 3)
cat("If n = 51, then ratio =", ratio <- round(chi_1/chi_2, 3))
## If n = 51, then ratio = 0.558
- 따라서 특정 검정력(power=0.9)에서 \(H_0 : \sigma^2 \leq \sigma_0^2\) vs \(H_A : \sigma^2 > \sigma_0^2\) 을 수행하기 위해
필요한 최소한의 표본크기는 51 이라는 사실을 알 수 있다.
EXAMPLE 7.13
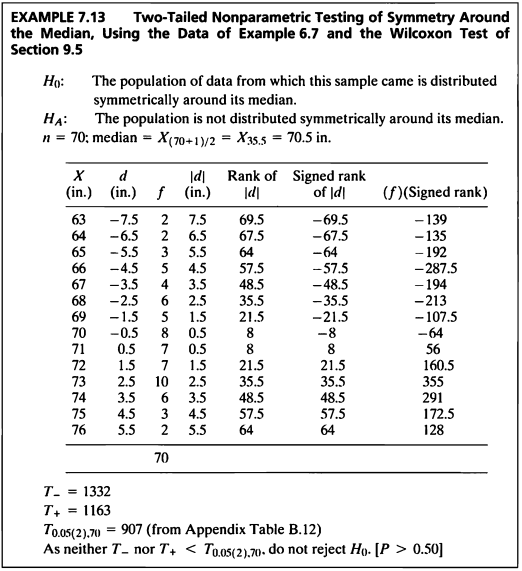
- 데이터가 정규성을 따르지 않거나 데이터의 분포를 모르고,
1 sample일 때 비모수적 검정으로 Wilcoxon singed rank test를 사용할 수 있다. - 중위수 주변의 대칭성 검정을 하기 위해 Example 6.7 데이터를 사용하여 검정을 해보도록 한다.
height = seq(63,76,1)
freq = c(2,2,3,5,4,6,5,8,7,7,10,6,3,2)
ex7_13 = rep(height, freq)
shapiro.test(ex7_13)
##
##  Shapiro-Wilk normality test
##
## data:  ex7_13
## W = 0.96455, p-value = 0.04485
- Shapiro-wilk test를 통해 정규성을 검정해 본 결과,
p-value가 0.045로 유의수준 0.05보다 작기 때문에 데이터가 정규분포를 따른다는 귀무가설을 기각하고
비모수적 검정을 진행하였다.
wilcox.test(ex7_13, mu=70.5, paired=F, alternative="two.sided", conf.level=0.95, correct=T)
##
##  Wilcoxon signed rank test with continuity correction
##
## data:  ex7_13
## V = 1153, p-value = 0.6011
## alternative hypothesis: true location is not equal to 70.5
- Wilcoxon singed rank test 결과를 살펴보면
p-value가 0.6011로 유의수준 0.05보다 크기 때문에 귀무가설을 기각할 수 없고
따라서 데이터는 중앙값을 중심으로 대칭적으로 분포되어 있다고 볼 수 있다.
SAS 프로그램 결과
SAS 접기/펼치기 버튼
7장
LIBNAME ex 'C:\Biostat';
RUN;

/*7장 연습문제 불러오기*/
%macro chap07(name=,no=);
%do i=1 %to &no.;
	PROC IMPORT DBMS=excel
		DATAFILE="C:\Biostat\data_chap07"
		OUT=ex.&name.&i. REPLACE;
		RANGE="exam7_&i.$";
	RUN;
%end;
%mend;

%chap07(name=ex7_,no=13);
EXAMPLE 7.1
PROC IMPORT DBMS=excel
		DATAFILE="C:\Biostat\data_chap07"
		OUT=ex.ex7_1 REPLACE;
		RANGE="exam7_1$";
RUN;

DATA ex.ex7_1;
set ex.ex7_1;
if _N_=1 then delete;
RUN;

PROC TTEST DATA=ex.ex7_1 h0=24.3;
	var temperature;
RUN;
The TTEST Procedure
Variable: Temperature (Temperature)
| N | Mean | Std Dev | Std Err | Minimum | Maximum |
|---|---|---|---|---|---|
| 25 | 25.0280 | 1.3418 | 0.2684 | 22.9000 | 28.1000 |
| Mean | 95% CL Mean | Std Dev | 95% CL Std Dev | ||
|---|---|---|---|---|---|
| 25.0280 | 24.4741 | 25.5819 | 1.3418 | 1.0477 | 1.8667 |
| DF | t Value | Pr > |t| |
|---|---|---|
| 24 | 2.71 | 0.0121 |
EXAMPLE 7.2
PROC IMPORT DBMS=excel
		DATAFILE="C:\Biostat\data_chap07"
		OUT=ex.ex7_2 REPLACE;
		RANGE="exam7_2$";
RUN;

PROC TTEST DATA=ex.ex7_2 h0=0;
	var weightchange;
RUN;
The TTEST Procedure
Variable: weightchange (weightchange)
| N | Mean | Std Dev | Std Err | Minimum | Maximum |
|---|---|---|---|---|---|
| 12 | -0.6500 | 1.2523 | 0.3615 | -2.0000 | 1.7000 |
| Mean | 95% CL Mean | Std Dev | 95% CL Std Dev | ||
|---|---|---|---|---|---|
| -0.6500 | -1.4457 | 0.1457 | 1.2523 | 0.8871 | 2.1262 |
| DF | t Value | Pr > |t| |
|---|---|---|
| 11 | -1.80 | 0.0996 |
EXAMPLE 7.3
PROC IMPORT DBMS=excel
		DATAFILE="C:\Biostat\data_chap07"
		OUT=ex.ex7_3 REPLACE;
		RANGE="exam7_3$";
RUN;

PROC TTEST DATA=ex.ex7_3 sides=L;
	var weightchange;
RUN;
The TTEST Procedure
Variable: weightchange (weightchange)
| N | Mean | Std Dev | Std Err | Minimum | Maximum |
|---|---|---|---|---|---|
| 12 | -0.6083 | 0.6331 | 0.1828 | -1.6000 | 0.4000 |
| Mean | 95% CL Mean | Std Dev | 95% CL Std Dev | ||
|---|---|---|---|---|---|
| -0.6083 | -Infty | -0.2801 | 0.6331 | 0.4485 | 1.0750 |
| DF | t Value | Pr < t |
|---|---|---|
| 11 | -3.33 | 0.0034 |
EXAMPLE 7.4
PROC IMPORT DBMS=excel
		DATAFILE="C:\Biostat\data_chap07"
		OUT=ex.ex7_4 REPLACE;
		RANGE="exam7_4$";
RUN;

PROC TTEST DATA=ex.ex7_4 h0=45 sides=U;
	var gastricjuice;
RUN;
The TTEST Procedure
Variable: gastricjuice (gastricjuice)
| N | Mean | Std Dev | Std Err | Minimum | Maximum |
|---|---|---|---|---|---|
| 8 | 45.2125 | 1.6401 | 0.5799 | 42.7000 | 47.6000 |
| Mean | 95% CL Mean | Std Dev | 95% CL Std Dev | ||
|---|---|---|---|---|---|
| 45.2125 | 44.1139 | Infty | 1.6401 | 1.0844 | 3.3380 |
| DF | t Value | Pr > t |
|---|---|---|
| 7 | 0.37 | 0.3624 |
EXAMPLE 7.5
/*95% 신뢰구간*/
PROC TTEST DATA=ex.ex7_1 h0=24.3 alpha=0.05;
	var Temperature;
RUN;

/*99% 신뢰구간*/
PROC TTEST DATA=ex.ex7_1 h0=24.3 alpha=0.01;
	var Temperature;
RUN;
The TTEST Procedure
Variable: Temperature (Temperature)
| N | Mean | Std Dev | Std Err | Minimum | Maximum |
|---|---|---|---|---|---|
| 25 | 25.0280 | 1.3418 | 0.2684 | 22.9000 | 28.1000 |
| Mean | 95% CL Mean | Std Dev | 95% CL Std Dev | ||
|---|---|---|---|---|---|
| 25.0280 | 24.4741 | 25.5819 | 1.3418 | 1.0477 | 1.8667 |
| DF | t Value | Pr > |t| |
|---|---|---|
| 24 | 2.71 | 0.0121 |
The TTEST Procedure
Variable: Temperature (Temperature)
| N | Mean | Std Dev | Std Err | Minimum | Maximum |
|---|---|---|---|---|---|
| 25 | 25.0280 | 1.3418 | 0.2684 | 22.9000 | 28.1000 |
| Mean | 99% CL Mean | Std Dev | 99% CL Std Dev | ||
|---|---|---|---|---|---|
| 25.0280 | 24.2774 | 25.7786 | 1.3418 | 0.9739 | 2.0906 |
| DF | t Value | Pr > |t| |
|---|---|---|
| 24 | 2.71 | 0.0121 |
EXAMPLE 7.6
PROC IML;
 	use ex.ex7_1; read ALL;
    mean=mean(Temperature); n=25; var=var(Temperature); m=8;
    CI1_L=mean-2.064*(sqrt((var/m)+(var/n)));
    CI1_U=mean+2.064*(sqrt((var/m)+(var/n)));
    CI2_L=mean-2.064*(sqrt((var)+(var/n)));
    CI2_U=mean+2.064*(sqrt((var)+(var/n)));
print CI1_L CI1_U CI2_L CI2_U;
RUN;
QUIT;
| CI1_L | CI1_U | CI2_L | CI2_U |
|---|---|---|---|
| 23.903032 | 26.152968 | 22.203674 | 27.852326 |
EXAMPLE 7.7
**1) 직접 계산;
PROC IML;
reset nolog; use ex.ex7_3; read all; close ex.ex7_3;
%macro ntest(alpha,side,n2);
d=0.25;
n=nrow(weightchange);
df=n-1;
x_bar = round(mean(weightchange),0.01);

x2=sum(weightchange`*weightchange);
sum_sq= x2-((sum(weightchange))**2)/n;
ss_sq=round(sum_sq/(n-1),0.01);
ss= round(sqrt(ss_sq/n),0.01);

if  &side = "two"  then ct =round(abs(quantile("t",&alpha/2,&n2)),0.001);
else ct =round(abs(quantile("t",&alpha,&n2)),0.001);
est_n = round((ss_sq*(ct**2)/(d**2)),1);

print x_bar ss_sq est_n;

%mend;
%ntest(0.05,"two",40);
%ntest(0.05,"two",27);
RUN;
QUIT;

**2) for문 계산;
PROC IML;
reset nolog; use ex.ex7_3; read all; close ex.ex7_3;
d=0.25;
x2=sum(weightchange`*weightchange);
sum_sq= x2-((sum(weightchange))**2)/nrow(weightchange);
ss_sq=round(sum_sq/(nrow(weightchange)-1),0.0001); *var; std= round(sqrt(ss_sq),0.001);

%macro ntest2(alpha); cd=repeat(t(0), 101,1);
do n=2 to 101 by 1;
df=n-1;
t=round(abs(quantile("t",&alpha/2,df)),0.001);
find = t*std/sqrt(n);
cd[n] = (abs(d-find));
end;
do n=2 to 101 by 1;
if cd[n]= min(cd[2:101]) then ss=n;
end;
sdf=ss-1;
st=round(abs(quantile("t",&alpha/2,df)),0.001);
sd= round(st*std/sqrt(ss),0.0001);
print sd ss;
%mend;
%ntest2(0.05);
RUN;
QUIT;
| x_bar | ss_sq | est_n |
|---|---|---|
| -0.61 | 0.4 | 26 |
| x_bar | ss_sq | est_n |
|---|---|---|
| -0.61 | 0.4 | 27 |
| sd | ss |
|---|---|
| 0.2417 | 27 |
EXAMPLE 7.8
PROC POWER;
	onesamplemeans test=t
	mean=1 stddev=1.25 ntotal=. power=0.90;
RUN;
The POWER Procedure
One-Sample t Test for Mean
| Fixed Scenario Elements | |
|---|---|
| Distribution | Normal |
| Method | Exact |
| Mean | 1 |
| Standard Deviation | 1.25 |
| Nominal Power | 0.9 |
| Number of Sides | 2 |
| Null Mean | 0 |
| Alpha | 0.05 |
| Computed N Total | |
|---|---|
| Actual Power | N Total |
| 0.909 | 19 |
EXAMPLE 7.9
PROC IML;
 use ex.ex7_2; read all;
 var=1.5682; n=25;
 s=sqrt(var/n);
 t1=-tinv(0.05/2,24);
 t2=-tinv(0.10/1,24);
 delta=round((s*(t1+t2)), 0.01);
 print delta;
RUN;
QUIT;
| delta |
|---|
| 0.85 |
EXAMPLE 7.10
PROC POWER ;
onesamplemeans test=t
nullmean = 1
mean=0
stddev = 1.2523
ntotal = 15
power=.;
RUN;
The POWER Procedure
One-Sample t Test for Mean
| Fixed Scenario Elements | |
|---|---|
| Distribution | Normal |
| Method | Exact |
| Null Mean | 1 |
| Mean | 0 |
| Standard Deviation | 1.2523 |
| Total Sample Size | 15 |
| Number of Sides | 2 |
| Alpha | 0.05 |
| Computed Power |
|---|
| Power |
| 0.820 |
EXAMPLE 7.11
PROC IML;
	use ex.ex7_4; read all;
	n=8;
 	var=2.6898;
 	ss=18.8288;
 	sigma=1.5;
 	x=(n-1)*(var/sigma);
  	p=1-cdf('chisq',x,n-1);
 	chi=CINV( 0.95,n-1);
 	print   x chi p;
RUN;
QUIT;
| x | chi | p |
|---|---|---|
| 12.5524 | 14.06714 | 0.0837947 |
EXAMPLE 7.12
PROC IML;
	use ex.ex7_4; read all;
	alpha=0.05;
	beta=0.10;
	n1=30;
    n2=50;
	n3=51;
	chi_30_size=round(quantile('chisq', beta, (n1-1)), 0.001)/round(quantile('chisq', 1-alpha, (n1-1)), 0.001);
	chi_50_size=round(quantile('chisq', beta, (n2-1)), 0.001)/round(quantile('chisq', 1-alpha, (n2-1)), 0.001);
	chi_51_size=round(quantile('chisq', beta, (n3-1)), 0.001)/round(quantile('chisq', 1-alpha, (n3-1)), 0.001);
	print chi_30_size  chi_50_size chi_51_size;
RUN;
QUIT;
| chi_30_size | chi_50_size | chi_51_size |
|---|---|---|
| 0.4645064 | 0.5549978 | 0.5583142 |
EXAMPLE 7.13
PROC UNIVARIATE DATA=ex.ex6_7 mu0=70.5 loccount;
    VAR height;
RUN;
UNIVARIATE 프로시저
변수: Height (Height)
| 적률 | |||
|---|---|---|---|
| N | 14 | 가중합 | 14 |
| 평균 | 69.5 | 관측값 합 | 973 |
| 표준 편차 | 4.18330013 | 분산 | 17.5 |
| 왜도 | 0 | 첨도 | -1.2 |
| 제곱합 | 67851 | 수정 제곱합 | 227.5 |
| 변동계수 | 6.01913688 | 평균의 표준 오차 | 1.11803399 |
| 기본 통계 측도 | |||
|---|---|---|---|
| 위치측도 | 변이측도 | ||
| 평균 | 69.50000 | 표준 편차 | 4.18330 |
| 중위수 | 69.50000 | 분산 | 17.50000 |
| 최빈값 | . | 범위 | 13.00000 |
| 사분위수 범위 | 7.00000 | ||
| 위치모수 검정: Mu0=70.5 | ||||
|---|---|---|---|---|
| 검정 | 통계량 | p 값 | ||
| 스튜던트의 t | t | -0.89443 | Pr > |t| | 0.3874 |
| 부호 | M | -1 | Pr >= |M| | 0.7905 |
| 부호 순위 | S | -13.5 | Pr >= |S| | 0.4199 |
| 위치모수: Mu0=70.50 | |
|---|---|
| 빈도 | 값 |
| 관측값 개수 > Mu0 | 6 |
| 관측값 개수 ^= Mu0 | 14 |
| 관측값 개수 < Mu0 | 8 |
| 분위수(정의 5) | |
|---|---|
| 레벨 | 분위수 |
| 100% 최댓값 | 76.0 |
| 99% | 76.0 |
| 95% | 76.0 |
| 90% | 75.0 |
| 75% Q3 | 73.0 |
| 50% 중위수 | 69.5 |
| 25% Q1 | 66.0 |
| 10% | 64.0 |
| 5% | 63.0 |
| 1% | 63.0 |
| 0% 최솟값 | 63.0 |
| 극 관측값 | |||
|---|---|---|---|
| 최소 | 최대 | ||
| 값 | 관측값 | 값 | 관측값 |
| 63 | 1 | 72 | 10 |
| 64 | 2 | 73 | 11 |
| 65 | 3 | 74 | 12 |
| 66 | 4 | 75 | 13 |
| 67 | 5 | 76 | 14 |
교재: Biostatistical Analysis (5th Edition) by Jerrold H. Zar
**이 글은 22학년도 1학기 의학통계방법론 과제 자료들을 정리한 글 입니다.**
