[의학통계방법론] Ch6. The Normal Distribution
The Normal Distribution
R 프로그램 결과
R 접기/펼치기 버튼
패키지 설치된 패키지 접기/펼치기 버튼
getwd()
## [1] "C:/Biostat"
library("Hmisc")
library("readxl")
library("ggplot2")
library("vegan")
library("dplyr")
library("kableExtra")
library("psych")
엑셀파일불러오기
#모든 시트를 하나의 리스트로 불러오는 함수
read_excel_allsheets <- function(file, tibble = FALSE) {
  sheets <- readxl::excel_sheets(file)
  x <- lapply(sheets, function(X) readxl::read_excel(file, sheet = X))
  if(!tibble) x <- lapply(x, as.data.frame)
  names(x) <- sheets
  x
}
6장
6장 연습문제 불러오기
#data_chap06에 연습문제 6장 모든 문제 저장
data_chap06 <- read_excel_allsheets("data_chap06.xls")

#연습문제 각각 데이터 생성
for (x in 1:length(data_chap06)){
  assign(paste0('ex6_',c(3,4,7))[x],data_chap06[x])
  }

#연습문제 데이터 형식을 리스트에서 데이터프레임으로 변환
for (x in 1:length(data_chap06)){
  assign(paste0('ex6_',c(3,4,7))[x],data.frame(data_chap06[x]))
  }
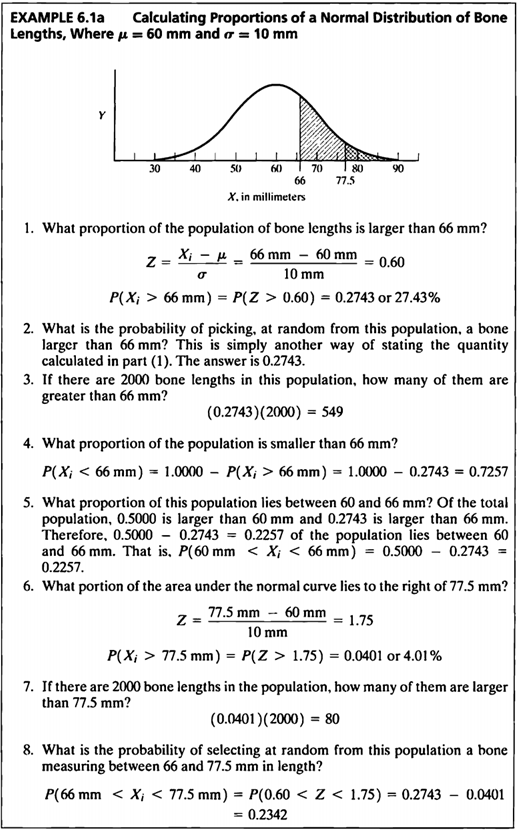
EXAMPLE 6.1a
x <- seq(30,90, length=200)
ar_x = seq(66,90,0.001)
x_p = c(ar_x, rev(ar_x))
ar_y=dnorm(ar_x, mean=60, sd=10)
y_p = c(rep(0,length(ar_y)),rev(ar_y))
ar_x2=seq(77.5,90,0.001)
x_p2= c(ar_x2, rev(ar_x2))
ar_y2=dnorm(ar_x2, mean=60, sd=10)
y_p2=c(rep(0,length(ar_y2)), rev(ar_y2))
plot(x, dnorm(x,mean=60, sd=10), type='l',xlab='Xi in millimeters', ylab="Y", yaxt="n",main="Example 6.1a : Calculating Proportions of a Normal Distribution of Bone Lengths")
polygon(x_p,y_p, col='#8dd3c7', density=30)
polygon(x_p2,y_p2, col='#ffffb3', density=50)
arrows(66,dnorm(66,60,10),66,0, angle=0)
text(57,0.006,labels='66',adj=0, cex=2, col='#007266')
arrows(77.5,dnorm(77.5,60,10),77.5,0, angle=0)
text(80,0.017,labels='77.5',adj=0, cex=2, col='#007266')
arrows(60,0.005,66,0,length=0.25, angle=30,code=2)
arrows(80,0.015,77.5,0.009,length=0.25, angle=30,code=2)

\(Q\).6.1a.1) What proportion of the population of bone lengths is larger than 66 \(mm\)?
#1
prop <- round((1-pnorm(66,60,10))*100,2)
cat("proportion of the population of bone lengths larer than 66 =",prop,"%")
## proportion of the population of bone lengths larer than 66 = 27.43 %
- 측정된 뼈 길이는 \(\mu = 60mm\)이고, \(\sigma=10mm\)인 정규분포를 따르고 있다.
- 해당 분포에서 뼈길이가 66mm 이상인 사람이 추출될 확률을 구하기 위해 pnorm 함수를 이용하였다.
- 그 결과, 뼈 길이가 66mm이상인 사람이 추출될 확률은 0.2473(24.73%)로 계산되었다.
\(Q\).6.1a.2) What is the probability of picking, at random from this population, a bone larger than 66 \(mm\)?
#2
prob <- round((1-pnorm(66,60,10)),4)
cat("probability of picking a bone lengths larer than 66 =",prob)
## probability of picking a bone lengths larer than 66 = 0.2743
\(Q\).6.1a.3) If there are 2000 bone lengths in population, how many of them are greater than 66 \(mm\)?
#3
popu <- round(2000*(1-pnorm(66,60,10)))
cat("population of bone length is greater than 66 mm in 2000 =",popu)
## population of bone length is greater than 66 mm in 2000 = 549
- 인구집단이 2000명일 경우, 뼈길이가 66mm이상인 사람의 수를 구해보자
- #1에서 계산된 확률 0.2473을 인구수인 2000에 곱하였고,
- 그 결과 2000명 중 549명의 뼈 길이가 66mm이상임을 알 수 있다.
\(Q\).6.1a.4) What proportion of the population is smaller than 66 \(mm\) ?
#4
prob <- round((pnorm(66,60,10)),4)
cat("probability of picking a bone lengths smaller than 66 =",prob)
## probability of picking a bone lengths smaller than 66 = 0.7257
- 뼈 길이가 66mm이하일 확률을 계산하였다.
- #1에서 구한 66mm이상일 확률과 반대되는 값으로 1에서 66mm이상일 확률을 뺐다.
- 해당 값은 0.7257임을 확인할 수 있다.
\(Q\).6.1a.5) What proportion of this population lies between 60 and 66 \(mm\)?
#5
p_60 <- 1-pnorm(60,60,10) # larger than 60 mm
p_66 <- 1-pnorm(66,60,10) # larger than 66 mm
p_60_66 <- round(p_60 - p_66,4)
cat("proportion between 60 and 66 = ",p_60,"-",round(p_66,4)," = ",p_60_66," or",round(p_60_66*100,2),"%")
## proportion between 60 and 66 = 0.5 - 0.2743 = 0.2257 or 22.57 %
- 뼈 길이가 60mm이상 66mm이하일 확률을 구하였다.
- (이는 정규분포로 변환한 \(0<Z<0.6\) 구간과 값이 동일하다)
- 60mm이하일 확률에서 66mm이상일 확률을 뺀 값으로 p-value는 0.2257임을 확인할 수 있다.
\(Q\).6.1a.6) What portion of the area under the normal curve lies to the right of 77.5 \(mm\)?
#6
prop <- round((1-pnorm(77.5,60,10))*100,2)
cat("proportion of the population of bone lengths larer than 77.5 =",prop,"%")
## proportion of the population of bone lengths larer than 77.5 = 4.01 %
- 뼈 길이가 77.5mm 이상일 확률을 구하였다.
- 해당 값을 구하기 위해 표준화를 실시하였고,
- 표준정규분포의 확률을 구한 결과 뼈 길이가 77.5mm이상일 확률은 0.0401 (4.01%)로 계산되었다.
\(Q\).6.1a.7) If there are 2000 bone lengths in population, how many of them are greater than 77.5 \(mm\)?
#7
popu <- round(2000*(1-pnorm(77.5,60,10)))
cat("population of bone length is greater than 77.5 mm in 2000 =",popu)
## population of bone length is greater than 77.5 mm in 2000 = 80
- 인구 2000명에서 뼈 길이가 77.5mm이상인 사람의 수는 80명이다.
\(Q\).6.1a.8) What is the probability of selecting at random from this population a bone measuring between 66 and 77.5 \(mm\) in length?
#8
p_66 <- 1-pnorm(66,60,10) # larger than 66 mm
p_77_5 <- 1-pnorm(77.5,60,10) # larger than 77.5 mm
p_66_77_5 <- round(p_66 - p_77_5,4)
cat("proportion between 66 and 77.5 = ",round(p_66,4),"-",round(p_77_5,4)," = ",p_66_77_5," or",round(p_66_77_5*100,2),"%")
## proportion between 66 and 77.5 = 0.2743 - 0.0401 = 0.2342 or 23.42 %
- 뼈 길이가 60mm에서 77.5mm 사이일 확률을 나타낸 값으로 이는 60mm이하 확률에서 77.5mm이하일 확률을 뺀 값으로 나타낼 수 있다.
- 그 결과 p-value는 0.2342이다.
- Example6.1a를 통해 분포의 평균으로부터 값이 멀어질수록 나타날 확률이 작아지는 것을 확인할 수 있다.
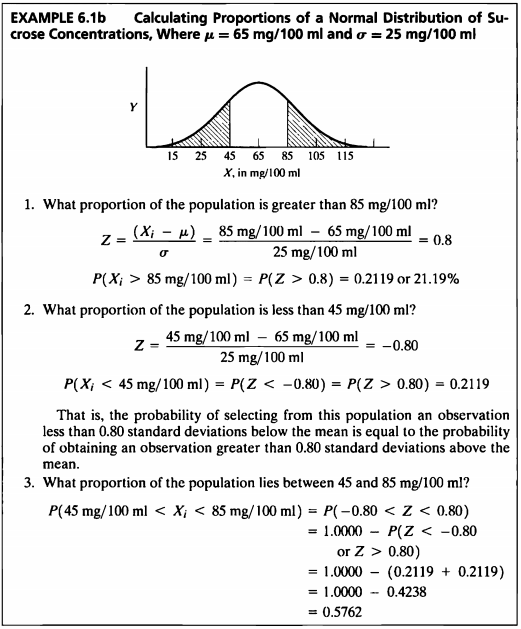
EXAMPLE 6.1b
#normal distribution plot
x <- seq(-25,150, length=300)
#45구간
ar_x = seq(-25,45,0.001)
x_p = c(ar_x, rev(ar_x))
ar_y=dnorm(ar_x, mean=65, sd=25)
y_p = c(rep(0,length(ar_y)),rev(ar_y))
##85구간
ar_x2=seq(85,150,0.001)
x_p2= c(ar_x2, rev(ar_x2))
ar_y2=dnorm(ar_x2, mean=65, sd=25)
y_p2=c(rep(0,length(ar_y2)), rev(ar_y2))
#plot
plot(x, dnorm(x,mean=65, sd=25), type='l',xlab='X,in mg/100ml', ylab="Y", yaxt="n",main="Example 6.1b : Calculating Proportions of a Normal Distribution of Sucrose Concentration")
polygon(x_p,y_p, col='#8dd3c7', density=50)
polygon(x_p2,y_p2, col='#8dd3c7', density=50)
arrows(45,dnorm(45,65,25),45,0, angle=0)
text(20,0.012,labels='45',adj=0, cex=2, col='#007266')
arrows(85,dnorm(85,65,25),85,0, angle=0)
text(105,0.012,labels='85',adj=0, cex=2, col='#007266')
arrows(30,0.012,45,0.0115,length=0.25, angle=30,code=2)
arrows(100,0.012,85,0.0115,length=0.25, angle=30,code=2)

\(Q\) 6.1b.1) What proportion of the population is greater than \(85 mg\) / \(100ml\) ?
#1
prop <- round(((1-pnorm(85,65,25))*100),2)
cat("proportion of the population of Sucrose Concentration larger than 85mg/100ml =",prop,"%")
## proportion of the population of Sucrose Concentration larger than 85mg/100ml = 21.19 %
- 측정된 당 농도(sucrose concentration)은 \(\mu = 65mg/100ml\)이고, \(\sigma = 25mg/100ml\)인 정규분포를 따른다.
- 당농도가 85mg/100ml 이상일 확률을 구한 값으로 0.2119 (21.19%)로 계산되었다.
\(Q\) 6.1b.2) What proportion of the population is less than \(45mg\) / \(100ml\) ?
#2
prop <- round(((pnorm(45,65,25))*100),2)
cat("proportion of the population of Sucrose Concentration less than 45mg/100ml =",prop,"%")
## proportion of the population of Sucrose Concentration less than 45mg/100ml = 21.19 %
- #1과 같은 값이 나오는 이유는 45mg/100ml와 85mg/100ml는 평균 65mg/100ml 기준으로 대칭을 이루기 때문이다.
\(Q\) 6.1b.3) What proportion of the population lies between \(45\) and \(85mg\) / \(100ml\) ?
#3
p_45 <- round(pnorm(45,65,25),4) #less than 45
p_85 <- round(1-pnorm(85,65,25),4)#larger than 85
p_45_85 <- round((1-(p_45+p_85))*100,2) #between 45 and 85
cat("proportion of the population of Sucrose Concentration between 45 and 85mg/100ml =",p_45_85,"%")
## proportion of the population of Sucrose Concentration between 45 and 85mg/100ml = 57.62 %
- 당농도가 45mg/100ml와 85mg/100ml 사이의 값을 가질 확률의 값으로 0.5762가 계산되었다.
EXAMPLE 6.2

\(Q\) 6.2.1) A population of one-year-old children’s chest circumstances has \(\mu=47.0\ cm\) and \(\sigma = 12.0\ cm\), what is the probability of drawing from it a random sample of nine measurements that has a mean larger than 50.0\(cm\) ?
#1
mu <- 47 ; sigma <- 12 ; n <- 9
sigma_xbar <- sigma/sqrt(n)
z <- (50-mu)/sigma_xbar
p <- 1-pnorm(z)
cat("Probability of mean larger than 50.0cm = ",round(p,4))
## Probability of mean larger than 50.0cm = 0.2266
- 1세 아동의 모집단의 가슴둘레 분포는 \(\mu=47cm\)이고, \(\sigma=12cm\)인 정규분포를 따른다.
- 9명의 아동을 추출했을 때의 표준오차는 \(\frac{\sigma}{\sqrt{n}}=\frac{12}{\sqrt{9}}=4cm\)
\(\overline{x}\) \(\frac{(\overline{X}-\mu)} {\sigma_{\overline{x}}} = \frac{50-47}{4} = 0.75\) \[P(\overline{X}>50)=P(Z>0.75)=0.2266\]
- 따라서 1세 아동 집단에서 가슴둘레의 평균이 50cm보다 큰 9명이 추출될 확률은 0.2266이다.
\(Q\) 6.2.2) What is the probability of drawing a sample of 25 measurements from the preceding population and finding that the mean of this sample is less than \(40.0 cm\)?
#2
mu <- 47 ; sigma <- 12 ; n <- 25
sigma_xbar <- sigma/sqrt(n)
z <- (40-mu)/sigma_xbar
p <- pnorm(z)
cat("Probability of mean less than 47.0cm = ",round(p,4))
## Probability of mean less than 47.0cm = 0.0018
- 25명의 아동을 추출했을 때의 표준오차는 \(\frac{\sigma}{\sqrt{n}}=\frac{12}{\sqrt{25}}=2.4cm\)이다.
- 따라서 1세 아동 집단에서 가슴둘레의 평균이 40cm보다 작은 25명이 추출될 확률은 0.0018이다.
\(Q\) 6.2.3) If 500 random samples of size 25 are taken from the preceding population, how many of then would have means larger than 50.0 \(cm\)?
#3
mu <- 47 ; sigma <- 12 ; n <- 25
sigma_xbar <- sigma/sqrt(n)
z <- (50-mu)/sigma_xbar
p <- 1-pnorm(z)
amount <- round(p,4)*500
cat("Amount of mean larger than 50.0cm = ",round(amount))
## Amount of mean larger than 50.0cm = 53
- 25명의 아동을 추출했을 때의 \(P(\overline{X}>50)\)는 \(P(Z>1.25)=0.1056\)이다.
- 표본의 수가 커질수록 추출될 확률의 값이 작아짐을 알 수 있다.
- 또한 평균으로부터 값이 멀어질수록 z값이 커져 p-value는 작아진다.
EXAMPLE 6.3

#데이터셋
ex6_3%>%
  kbl(caption = "EXAMPLE 6.3 dataset") %>%
  kable_minimal() %>%
  kable_styling(bootstrap_options = c("striped", "hover", "condensed", "responsive"))
| SBP |
|---|
| 121 |
| 125 |
| 128 |
| 134 |
| 136 |
| 138 |
| 139 |
| 141 |
| 144 |
| 145 |
| 149 |
| 151 |
descriptives6.3  <- function(x) {
  x <- na.omit(x)
  n <- length(x)
  sum_x <- sum(x)
  sum_x2 <- sum(x^2)
  mean <- mean(x)
  ss <- sum_x2-(sum_x^2/12)
  s2 <- ss/(n-1)
  s <- sqrt(s2)
  s_err <- s/sqrt(n)
  out <- data.frame(n=n, Mean=round(mean,1) ,Sum_X=sum_x, Sum_x2 = sum_x2, Sum_of_Square=round(ss,4), variance=round(s2,4), std=round(s,2), std.err=round(s_err,1))
  return(out)
}

descriptives6.3 (ex6_3$SBP)%>%
  kbl(caption = "Descriptives ex6.3") %>%
  kable_minimal() %>%
  kable_styling(bootstrap_options = c("striped", "hover", "condensed", "responsive"))
| n | Mean | Sum_X | Sum_x2 | Sum_of_Square | variance | std | std.err |
|---|---|---|---|---|---|---|---|
| 12 | 137.6 | 1651 | 228111 | 960.9167 | 87.3561 | 9.35 | 2.7 |
- 12마리 침팬치의 수축기 혈압데이터이다.
- 붓스트랩을 통해 평균의 표준오차를 구하는 방법은 다음과 같다.
- 1000개의 붓스트랩 표본으로 계산을 해보면 다음과 같다.
boot.mean <- function(data,num){
  resamples <- lapply(1:num, function(i) sample(data,replace=T))
  r.mean <- sapply(resamples,mean)
  std.err <- sqrt(var(r.mean))
  list(std.err = std.err, resamples=resamples,mean=r.mean)
}

boot <- data.frame(std.err=boot.mean(ex6_3$SBP,1000)$std.err, mean=boot.mean(ex6_3$SBP,1000)$mean)
ggplot(boot,(aes(x=mean)))+
  geom_histogram(fill="#8dd3c7",color="#ffffb3",binwidth=0.8)+
  xlab("Means of Bootstrap data6_3") + ylab("Frequency") +
  ggtitle("Histogram of Bootstrap data6_3")+
  theme_bw()+
  theme(legend.position = "right")+
  theme(legend.text = element_text(size=15))+
  theme(legend.title = element_text(size=15))+
  theme(axis.text.x  = element_text(size=10))+
  theme(axis.text.y=element_text(size=10))+
  theme(axis.title = element_text(size=20))+
  theme(plot.title = element_text(size=16,hjust = 0.5))+
  annotate("text", x=130, y=120, label=paste0("Mean = ",round(mean(boot$mean),1)), size=5,hjust=0)+
  annotate("text", x=130, y=110, label=paste0("Std err = ",round(boot$std.err,1)), size=5,hjust=0)

| statistics | Original Data | Bootstrap Data |
|---|---|---|
| Mean | 137.6 | 137.7 |
| Standard Error | 2.7 | 2.6 |
- ex6_3 데이터에서 구한 평균의 표준오차와 붓스트랩 데이터에서 추출한 평균의 표준오차가 크게 차이가 나지 않음을 알 수 있으며,
- 이는 표본의 수가 많을수록 표본평균의 평균과 표준오차는 모집단인 본 데이터의 평균과 표준오차와 근사한다.
EXAMPLE 6.4
#데이터셋
ex6_4%>%
  kbl(caption = "EXAMPLE 6.4 dataset") %>%
  kable_minimal() %>%
  kable_styling(bootstrap_options = c("striped", "hover", "condensed", "responsive"))
| X |
|---|
| 2.0 |
| 1.1 |
| 4.4 |
| -3.1 |
| -1.3 |
| 3.9 |
| 3.2 |
| -1.6 |
| 3.5 |
| 1.2 |
| 2.5 |
| 2.3 |
| 1.9 |
| 1.8 |
| 2.9 |
| -0.3 |
| -2.4 |
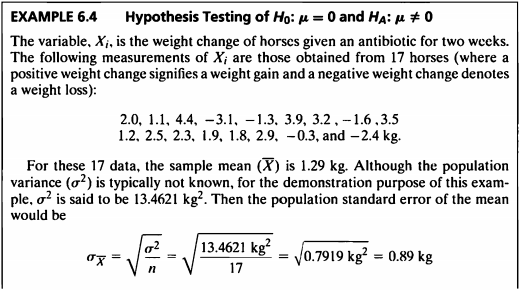
- ex6_4 데이터는 17마리의 말을 조사한 데이터이며 2주간 항생제를 투여한 후 몸무게의 증감을 나타내고 있다.
- 말들의 몸무게의 변화양의 모평균이 0인지 유의수준 5%에서 검정한다.
descriptives6_4 <- function(x){
  n <- length(x)
  mean_x <- mean(x)
  var_x <- 13.4621
  se <- sqrt(var_x/n)
  z_value <- (mean_x-0)/se
  p_value <- 2*(1-pnorm(z_value))
  out <- data.frame(n=n,mean=round(mean_x,2),Variance=var_x,SE=round(se,2),Z=round(z_value,2),P_value = round(p_value,4))
  return(out)
}

descriptives6_4(ex6_4$X)%>%
  kbl(caption = "Descriptives ex6.4") %>%
  kable_minimal() %>%
  kable_styling(bootstrap_options = c("striped", "hover", "condensed", "responsive"))
| n | mean | Variance | SE | Z | P_value |
|---|---|---|---|---|---|
| 17 | 1.29 | 13.4621 | 0.89 | 1.45 | 0.1459 |
- 표본평균 \(\overline{X}\)는 \(1.29kg\) 이고 모분산은 모르지만 \(13.4621kg^2\) 로 가정하자.
- 그러면 표준 오차는 다음과 같이 계산된다.
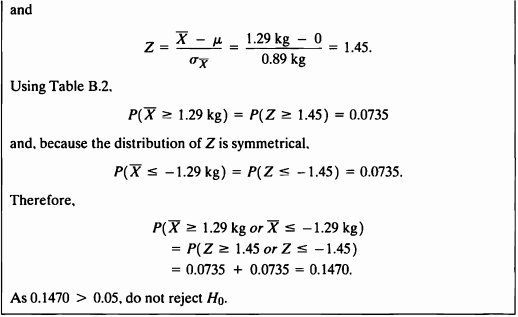
- 표준화한 Z 값을 구하면 다음과 같다.
- 이를 통해 유의확률을 구해보면 다음과 같다.
- 그리고 Z분포는 0에 대하여 대칭이기 때문에 다음도 성립한다.
- 최종적인 유의확률은 다음과 같다.
- 구해진 \(p\ value\) 는 0.1470 으로 유의확률 0.05 보다 크므로 귀무가설 \(H_0\) 를 기각시키지 못한다.
- 그러므로 말들의 모평균의 몸무게 변화가 있다고 할 충분한 근거가 없다.
zz <- descriptives6_4(ex6_4$X)$Z
curve(dt(x,16),-3,3,xlab="z",ylab="Y",yaxt='n',main="Hypothesis in Example 6.4")
polygon(c(zz,seq(zz,3,0.001),zz),
        c(dt(-3,16),dt(seq(zz,3,0.001),16),dt(-3,16)),col="#007266")
polygon(c(-3,seq(-3,-zz,0.001),-zz),
        c(dt(-3,16),dt(seq(-3,-zz,0.001),16),dt(-3,16)),col="#007266")
polygon(c(1.96,seq(1.96,3,0.001),1.96),
        c(dt(-3,16),dt(seq(1.96,3,0.001),16),dt(-3,16)),col="#8dd3c7")
polygon(c(-3,seq(-3,-1.96,0.001),-1.96),
        c(dt(-3,16),dt(seq(-3,-1.96,0.001),16),dt(-3,16)),col="#8dd3c7")
text(x=-2,y=0.1,labels = "-1.96")
text(x=2,y=0.1,labels = "1.96")
text(x=-1.45,y=0.18,labels = "-1.45")
text(x=1.45,y=0.18,labels = "1.45")

EXAMPLE 6.5

- 6.5.1) Hypothetical outcomes of testing the same null hypothesis for 2500 random samples
- 제 1종 오류 (Type 1 error) : 귀무가설이 참임이에도 불구하고 이를 기각할 오류
- 제 2종 오류 (Type 2 error) : 귀무가설이 거짓임에도 불구하고 이를 기각하지 못할 오류
| If \(H_0\) is true | If \(H_0\) is false | Row total | |
|---|---|---|---|
| If \(H_0\) is rejected | 100 | 450 | 550 |
| If \(H_0\) is not rejected | 1900 | 50 | 1950 |
| Column total | 2000 | 500 | 2500 |
- Probability that \(H_0\) is rejected if \(H_0\) is true \(= 100/2000=0.05\)
- Probability that \(H_0\) is true if \(H_0\) is rejected \(=100/550=0.18\)
- 6.5.2) Table of the Two types of Errors in Hypothesis Testing
| If \(H_0\) is true | If \(H_0\) is false | |
|---|---|---|
| If \(H_0\) is rejected | \(Type\ 1\ Error\) | \(No\ Error\) |
| If \(H_0\) is not rejected | \(No\ Error\) | \(Type\ 2\ Error\) |
- 6.5.3) The Long - Term Probabilities of Outcomes in Hypothesis Testing
| If \(H_0\) is true | If \(H_0\) is false | |
|---|---|---|
| If \(H_0\) is rejected | \(\alpha\) | \(1-\beta\ (Power)\) |
| If \(H_0\) is not rejected | \(1-\alpha\) | \(\beta\) |
EXAMPLE 6.6
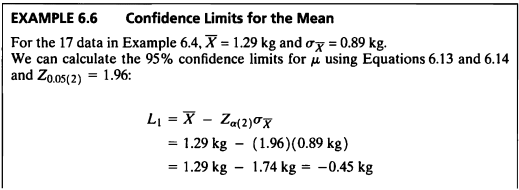
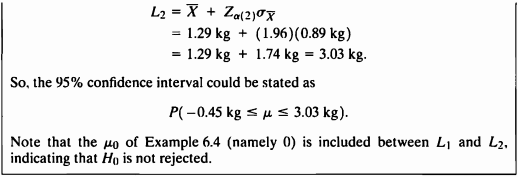 \[\begin{aligned} \overline{X}=1.29\ kg \ and \ \sigma_\overline{X}=0.89\ kg \\ (L, U) = (\bar{X} - Z_{\alpha/2} \sigma_{\overline{X}},\ \overline{X} + Z_{\alpha/2} \sigma_{\bar{X}}) \end{aligned}\]
descriptives6.6 <- function(x) {
  x.n <- 17
  x.mn <- 1.29
  x.se <- 0.89
  LL <- x.mn-1.96*x.se
  UL <- x.mn+1.96*x.se
  x.total <- c(LL,UL)
  return(x.total)
}

cat("The 95% confidence interval is [",round(descriptives6.6(x)[1],2),",",round(descriptives6.6(x)[2],2),"]")
## The 95% confidence interval is [ -0.45 , 3.03 ]
Example 6.4에서 \(\mu_0=0\) 에 대한 검정을 했었고 이는 신뢰구간에 포함되므로 \(H_0\) 를 기각하지 못한다.
- 샘플링 한 값들에 대한 신뢰구간 시각화
- 본 데이터에서 100번 샘플링하여 이 값들에 대한 신뢰구간을 시각화하면 다음과 같다.
ex6.4 <- as.numeric(ex6_4$X)
mean0=mean(ex6.4)
mean0
## [1] 1.294118
x1 <- replicate(100,sample(ex6_4$X,17,replace=TRUE))
error.bars(x1, alpha=0.05, xlab="sample", ylab="Mean", col=adjustcolor("#8dd3c7",alpha=0.3), pch=16) # library('psych')
abline(h=mean0)

- 대부분의 값들이 평균을 크게 벗어나지 않을 것을 보이며,
신뢰구간은 대부분 평균을 포함하고있는 것을 볼 수 있다.
EXAMPLE 6.7
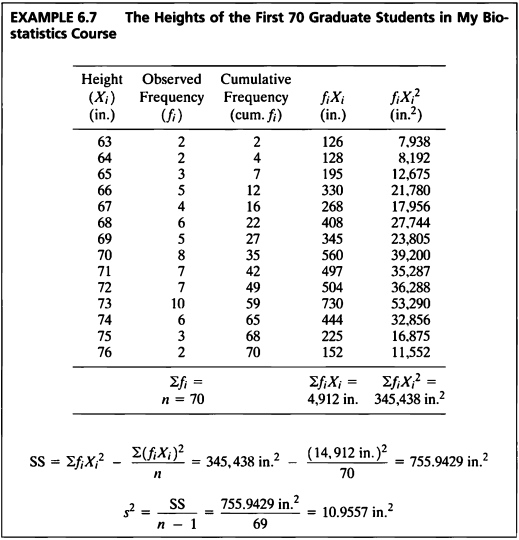
#데이터셋
ex6_7%>%
  kbl(caption = "EXAMPLE 6.7 dataset") %>%
  kable_minimal() %>%
  kable_styling(bootstrap_options = c("striped", "hover", "condensed", "responsive"))
| exam6_7.Height | exam6_7.Freq |
|---|---|
| 63 | 2 |
| 64 | 2 |
| 65 | 3 |
| 66 | 5 |
| 67 | 4 |
| 68 | 6 |
| 69 | 5 |
| 70 | 8 |
| 71 | 7 |
| 72 | 7 |
| 73 | 10 |
| 74 | 6 |
| 75 | 3 |
| 76 | 2 |
- 누적도수와 \(f_i X_i\), \(f_i {X_i}^2\) 를 구하면 다음과 같은 테이블이 나온다.
ex6_7$CumFreq <- cumsum(ex6_7$exam6_7.Freq) # 누적도수
ex6_7$fixi <- ex6_7$exam6_7.Height*ex6_7$exam6_7.Freq # fixi
ex6_7$fixi2<-ex6_7$exam6_7.Height^2*ex6_7$exam6_7.Freq #fixi^2
ex6_7%>%
  kbl(caption = "EXAMPLE 6.7 dataset") %>%
  kable_minimal() %>%
  kable_styling(bootstrap_options = c("striped", "hover", "condensed", "responsive"))
| exam6_7.Height | exam6_7.Freq | CumFreq | fixi | fixi2 |
|---|---|---|---|---|
| 63 | 2 | 2 | 126 | 7938 |
| 64 | 2 | 4 | 128 | 8192 |
| 65 | 3 | 7 | 195 | 12675 |
| 66 | 5 | 12 | 330 | 21780 |
| 67 | 4 | 16 | 268 | 17956 |
| 68 | 6 | 22 | 408 | 27744 |
| 69 | 5 | 27 | 345 | 23805 |
| 70 | 8 | 35 | 560 | 39200 |
| 71 | 7 | 42 | 497 | 35287 |
| 72 | 7 | 49 | 504 | 36288 |
| 73 | 10 | 59 | 730 | 53290 |
| 74 | 6 | 65 | 444 | 32856 |
| 75 | 3 | 68 | 225 | 16875 |
| 76 | 2 | 70 | 152 | 11552 |
- Sum of square(\(SS\)) 와 \(s^2\)을 구하면 다음과 같다.
ss <- sum(ex6_7$fixi2)-(sum(ex6_7$fixi)^2/sum(ex6_7$exam6_7.Freq))
s2 <- round(ss/(sum(ex6_7$exam6_7.Freq)-1),4)
cat("SS = ",ss,", s2 = ",s2)
## SS = 755.9429 , s2 = 10.9557
정규성검정 (Normality Test)
hist(rnorm(500,70.17143,sqrt(13.4621)),prob=T,col="white",border='white',axes=F,xlab = "",ylab="",main="The Frequency polygon for the student height data")
lines(density(rnorm(500,70.17143,sqrt(13.4621))), lty=2, lwd=2, col="#8F0185")
par(new=T)
plot(ex6_7$exam6_7.Height,ex6_7$exam6_7.Freq, ylim = c(0,10), xlim=c(62,78), col="#8dd3c7", type="l", lwd=3, xlab = "Height in inches(Xi)",ylab='Frequency', xaxt='n')
axis(1,at=c(62,64,66,68,70,72,74,76,78))
text(x=63.2, y=9, label="Mint", col="#8dd3c7", cex=0.8) ; text(x=63.2, y=8.5, label="puple", col="#8F0185", cex=0.8)
text(x=64.2, y=9, label=": Observed Frequencies", cex=0.8)
text(x=64.2, y=8.5, label=": Expected Frequencies", cex=0.8)

- 우리는 해당 데이터가 정규분포를 따르는지 검정을 하기 위해 다음의 방법들을 사용해보려고 한다.
- a) Graphical Assessment of Normality
- a-1) cumulative frequency polygon
- 다음 그래프는 누적빈도를 그래프로 그린 것이다.
cc <- ex6_7$CumFreq # 누적도수
scc <- sum(ex6_7$exam6_7.Freq) ; ccc <-cc/scc ; ccc <- round(ccc,2)
par(mar = c(5, 4, 4, 4)+0.1)
plot.new()
plot(x=ex6_7$exam6_7.Height, y=ccc,type='b', xlab="X in inches",ylab="Cumulative Frequency", yaxt="n", frame=F, ylim=c(0,1.1), cex.axis = 1, cex.lab=1, main="The Cummulative Frequency Polygon of the student height data", col="#8dd3c7")
points(x=ex6_7$exam6_7.Height, ccc, pch=16, col="#007266")
axis(side=4, at=round(ccc,2), las=2, lwd = 1, cex.axis=0.8)
par(new = TRUE)
plot(cc,xlab="", ylab="", main="", xaxt="n", yaxt='n', frame=F, ylim=c(0,70), col=adjustcolor("white",alpha=0), cex.axis = 1, cex.lab=1)
axis(2, cex.axis=1)
mtext("Cumulative Relative Frequency", side=4, line=3, cex = 1)

- 그래프를 살펴보면 S 모양 형태의 sigmoid 모양을 띄고 있는데
이 형태만 가지고 정규성을 검정하기에는 어려움이 있다.
ccc1 <- ccc*100
plot(x=ex6_7$exam6_7.Height,y=ccc1,xlab="X in inches",ylab="Cumulative Frequency in Percent",yaxt='n',frame=F,ylim=c(0,100),cex.axis = 1,cex.lab=1,main="The Cummulative Relative Frequency Distribution of the student height data", col="#8dd3c7")
points(x=ex6_7$exam6_7.Height, ccc1, pch=16, col="#007266")
axis(side=2,at=round(ccc1,2),las=2,lwd = 1,cex.axis=0.8)
lines(x=seq(62,78,length=100),y=seq(0,100,length=100))

- a-2) Q-Q plot
- Q-Q plot은 이론적 분위수와 경험적 분위수를 이용한 플롯으로
그래프의 선이 \(y=x\)를 따르면 정규성을 따른다고 한다.
qqnorm(ex6_7$exam6_7.Height,col="#8dd3c7", pch=16, lwd = 2) ; qqline(ex6_7$exam6_7.Height,col="#007266", lwd = 2)

- a-3) P-P plot
- P-P plot은 순서화된 데이터값까지의 경험적 누적 확률과 이론적 누적확률을 이용한 플롯이다.
- x 축에는 오름차순으로 정렬된 데이터 \(x_{(i)}\) 에 대응되는 표본에서의 누적확률 \(p_i\) 을 계산한다.
- 계산식은 다음과 같다.
- y 축에는 \(x-{(i)}\)에 대응되는 이론적인 정규분포에서의 누적확를 \(\Phi_{(x_{(i)})}\) 를 계산한다.
- 이를 그려보면 다음과 같다.
for(i in 1:nrow(ex6_7)){
  ex6_7$cc[i]<- (i-0.5)/length(ex6_7$exam6_7.Height)
}

ex6_7$cc <- round(ex6_7$cc*100,2)
nuj <- pnorm(ex6_7$exam6_7.Height,70.17143,sqrt(13.4621))
plot(x=nuj,y=ex6_7$cc,xlab="X in inches",ylab="Cumulative Frequency in Percent",xaxt='n',yaxt='n',frame=F,ylim=c(0,100),cex.axis = 1,cex.lab=1,main="P-P plot", col="#8dd3c7")
points(x=nuj,ex6_7$cc,pch=16, col="#8dd3c7")
axis(side=1,at=nuj,label=c("63","64","65","66","67","68","69","70","71","72","73","74","75","76"),lwd = 1,cex.axis=0.5)
axis(side=2,at=ex6_7$cc,las=2,lwd = 1,cex.axis=0.8)
lines(x=seq(0,1,length=100),y=seq(0,100,length=100), col="#007266", lwd = 2)

- 그러나 그래프를 사용한 결과만으로 정규성을 판단하기는 어렵다.
- b) Assessing Normality Using Symmetry and Kurtosis Measures
- 왜도는 평균에 대한 분포의 비대칭 정도로 0.5보다 크면 오른쪽으로 긴 형태이고
-0.5보다 작으면 왼쪽으로 꼬리가 긴 형태로 분포되어있다. - -0.5 < 왜도 < 0.5 사이 값이면 대칭적이다.
- 첨도는 분포의 뾰족한 정도를 나타내는 지표로 정규분포를 따를 경우 첨도는 3이다.
3보다 크면 많이 뾰족하며 3보다 작으면 완만한 형태를 띈다.
library('moments')
skew <- skewness(ex6_7$exam6_7.Height) # 왜도
kur <- kurtosis(ex6_7$exam6_7.Height) # 첨도
cat("왜도 = ",skew,", 첨도 = ",kur)
## 왜도 = 0 , 첨도 = 1.787692
- 왜도는 0 으로 대칭인 분포라 할 수 있으며
첨도는 1.787692로 정규분포보다는 완만한 형태를 가지고 있음을 알 수 있다.
- c) Goodness-of-Fit Assessment of Normality
- 정규성을 검정하는 방법으로는 적합도 검사(Goodness-of-fit) 를 할 수 있는데 방법의 수는 여러가지로 많다.
- 그 중 6개 정도를 보면 다음과 같다.
- c-1) Anderson-Darling test
library(nortest)
ad.test(ex6_7$exam6_7.Height)
##
##  Anderson-Darling normality test
##
## data:  ex6_7$exam6_7.Height
## A = 0.16777, p-value = 0.9185
- c-2) Cramer-von Mises test
cvm.test(ex6_7$exam6_7.Height)
##
##  Cramer-von Mises normality test
##
## data:  ex6_7$exam6_7.Height
## W = 0.021766, p-value = 0.9419
- c-3) Lilliefors test (Based on Kolmogorov-Smirnov test)
lillie.test(ex6_7$exam6_7.Height)
##
##  Lilliefors (Kolmogorov-Smirnov) normality test
##
## data:  ex6_7$exam6_7.Height
## D = 0.084322, p-value = 0.9971
- c-4) Shapiro-Francia test
sf.test(ex6_7$exam6_7.Height)
##
##  Shapiro-Francia normality test
##
## data:  ex6_7$exam6_7.Height
## W = 0.98186, p-value = 0.9579
- c-5) Shapiro-Wilk Normality test
shapiro.test(ex6_7$exam6_7.Height)
##
##  Shapiro-Wilk normality test
##
## data:  ex6_7$exam6_7.Height
## W = 0.96453, p-value = 0.7964
- c-6) Jarque-Bera test
library('tseries')
jarque.bera.test(ex6_7$exam6_7.Height)
##
##  Jarque Bera Test
##
## data:  ex6_7$exam6_7.Height
## X-squared = 0.85732, df = 2, p-value = 0.6514
위의 검정방법의 결과를 정리하면 다음과 같다.
cat("P value of Anderson-Darling test       : ",ad.test(ex6_7$exam6_7.Height)$p,"\n",
    "P value of Cramer-von Mises test       : ",cvm.test(ex6_7$exam6_7.Height)$p,"\n",
    "P value of Lilliefors test             : ",lillie.test(ex6_7$exam6_7.Height)$p,"\n",
    "P value of Shapiro-Francia test        : ",sf.test(ex6_7$exam6_7.Height)$p,"\n",
    "P value of Shapiro-Wilk Normality test : ",shapiro.test(ex6_7$exam6_7.Height)$p,"\n",
    "p value of Jarque-Bera test            : ",jarque.bera.test(ex6_7$exam6_7.Height)$p.value)
##  P value of Anderson-Darling test       :  0.9185035
##  P value of Cramer-von Mises test       :  0.9418611
##  P value of Lilliefors test             :  0.9970992
##  P value of Shapiro-Francia test        :  0.9579486
##  P value of Shapiro-Wilk Normality test :  0.7964376
##  p value of Jarque-Bera test            :  0.6513816
| Goodness-of-Fit | P value |
|---|---|
| Anderson-Darling test | 0.9185 |
| Cramer-von Mises test | 0.9419 |
| Lilliefors test | 0.9971 |
| Shapiro-Francia test | 0.9579 |
| Shapiro-Wilk Normality test | 0.7964 |
| Jarque-Bera test | 0.6514 |
\[\begin{aligned} H_0 &: Follow\ Normal\ Distribution\\ H_A &: Not\ H_0 \end{aligned}\]적합도 검정에 대한 가설 설정은 다음과 같다.
- 적합도 검정에 대한 결과를 보면 모두 p value가 유의수준 0.05보다 크므로 귀무가설 \(H_0\) 를 기각할 수 없다.
그러므로 해당 데이터는 정규분포를 따른다고 할 수 있다.
SAS 프로그램 결과
SAS 접기/펼치기 버튼
6장
LIBNAME ex 'C:\Biostat';
RUN;

/*6장 연습문제 불러오기*/
%macro chap06(name=,no=);
%do i=1 %to &no.;
	PROC IMPORT DBMS=excel
		DATAFILE="C:\Biostat\data_chap06"
		OUT=ex.&name.&i. REPLACE;
		RANGE="exam6_&i.$";
	RUN;
%end;
%mend;

%chap06(name=ex6_,no=7);
EXAMPLE 6.1a
options nosource nonotes errors=0 nosource2;

*** 밀도함수 ***;
DATA ex6_1a;
	DO x= 30 TO 90 BY 0.01;
		pdf= pdf("NORMAL", x,60,10);
	OUTPUT;
	END;
	DO x1= 65 TO 90 BY 0.01;
		n1= pdf("NORMAL", x1,60,10);
	OUTPUT;
	END;
	DO x2=77.5 TO 90 BY 0.01;
		n2=pdf("NORMAL",x2,60,10);
	OUTPUT;
	END;
RUN;

PROC SGPLOT DATA=ex6_1a;
	series x=x y=pdf /legendlabel="Normal Density Function";
	band x=x1 upper=n1 lower=0 /
	fillattrs=GraphData1(transparency=0.5 color="#8dd3c7")
	legendlabel="X > 66mm";
	band x=x2 upper=n2 lower=0/
	fillattrs=GraphData2(transparency=0.7 color="#ffffb3")
	legendlabel="X > 77.5mm";
	xaxis label="X in millimeters" grid values= (30 to 90 by 10);
	yaxis label="Y";
RUN;

DATA ex.ex6_1a;
	cdf1=round(1-cdf('normal', 0.60), 0.0001);
	size1=cdf1*2000;
	cdf2=1-cdf1;
	cdf3=round(0.5-cdf1, 0.0001);
	cdf4=round(1-cdf('normal', 1.75), 0.0001);
	size2=cdf4*2000;
	cdf5=round((1-cdf('normal', 0.60))-(1-cdf('normal', 1.75)), 0.0001);
RUN;

PROC PRINT DATA=ex.ex6_1a;
RUN;
| OBS | cdf1 | size1 | cdf2 | cdf3 | cdf4 | size2 | cdf5 |
|---|---|---|---|---|---|---|---|
| 1 | 0.2743 | 548.6 | 0.7257 | 0.2257 | 0.0401 | 80.2 | 0.2342 |
EXAMPLE 6.1b
*** 밀도함수 ***;
DATA ex6_1b;
	DO x= 15 TO 115 BY 0.01;
		pdf= pdf("NORMAL", x,65,25);
	OUTPUT;
	END;
	DO x1= 15 TO 45 BY 0.01;
		n1= pdf("NORMAL", x1,65,25);
	OUTPUT;
	END;
	DO x2=85 TO 115 BY 0.01;
		n2=pdf("NORMAL",x2,65,25);
	OUTPUT;
	END;
RUN;

PROC SGPLOT DATA=ex6_1b;
	series x=x y=pdf /legendlabel="Normal Density Function";
	band x=x1 upper=n1 lower=0 /
	fillattrs=GraphData1(transparency=0.7 color="#8dd3c7")
	legendlabel="X < 45mg/100ml";
	band x=x2 upper=n2 lower=0/
	fillattrs=GraphData2(transparency=0.7 color="#8dd3c7")
	legendlabel="X > 85mg/100ml";
	xaxis label="X in millimeters" grid values= (15 25 45 65 85 105 115);
	yaxis label="Y";
RUN;

DATA ex.ex6_1b;
	cdf1=round(1-cdf('normal', 0.80), 0.0001);
	cdf2=round(cdf('normal', -0.80), 0.0001);
	cdf3=round(1-(2*cdf1), 0.0001);
RUN;

PROC PRINT DATA=ex.ex6_1b;
RUN;
| OBS | cdf1 | cdf2 | cdf3 |
|---|---|---|---|
| 1 | 0.2119 | 0.2119 | 0.5762 |
EXAMPLE 6.2
DATA ex.ex6_2;
	mu=47 ; s=12; n1=9; n2=25; n3=25;
	sd1=s/sqrt(n1);
	Z1=(50-mu)/sd1;
	cdf1=round(1-cdf('normal', Z1), 0.0001);/*결과:0.2266*/

	sd2=s/sqrt(n2);
	Z2=(40-mu)/sd2;
	cdf2=round(cdf('normal', Z2),0.0001);/*결과:0.0018*/

	sd3=s/sqrt(n3);
	Z3=(50-mu)/sd3;
	cdf3=round(1-cdf('normal', Z3), 0.0001);/*결과:0.1056*/
	size3=round(500*cdf3,1);
RUN;

PROC PRINT DATA=ex.ex6_2;
	var cdf1 cdf2 cdf3 size3;
RUN;
| OBS | cdf1 | cdf2 | cdf3 | size3 |
|---|---|---|---|---|
| 1 | 0.2266 | .0018 | 0.1056 | 53 |
EXAMPLE 6.3
PROC IMPORT DBMS=excel
		DATAFILE="C:\Biostat\data_chap06"
		OUT=ex.ex6_3 REPLACE;
		RANGE="exam6_3$";
RUN;

PROC MEANS DATA= ex.ex6_3 N SUM MEAN VAR STD MAXDEC=4;
	var sbp;
RUN;

PROC IML;
	use ex.ex6_3; read ALL;
	sv=sqrt(VAR(sbp)/12);
	print sv;
RUN;
QUIT;
MEANS 프로시저
| 분석 변수: SBP SBP | ||||
|---|---|---|---|---|
| N | 합계 | 평균 | 분산 | 표준편차 |
| 12 | 1651.0000 | 137.5833 | 87.3561 | 9.3464 |
| sv |
|---|
| 2.6980867 |
EXAMPLE 6.4
PROC IMPORT DBMS=excel
		DATAFILE="C:\Biostat\data_chap06"
		OUT=ex.ex6_4 REPLACE;
		RANGE="exam6_4$";
RUN;

PROC IML;
	use ex.ex6_4; read ALL;
	sd=13.4621; n=17; mean=1.29; mu=0;
	se=sqrt(sd/n);
	Z=(mean-mu)/se;
	cdf=1-cdf('normal', Z);
    tt=cdf('normal', -Z);
	p=cdf+tt;
print 	 se Z  p ;
RUN;
QUIT;
| se | Z | p |
|---|---|---|
| 0.889881 | 1.449632 | 0.1471612 |
EXAMPLE 6.5
DATA ex.ex6_5;
INPUT reject $ TF $ COUNT @@;
CARDS;
reject TRUE 100
reject FALSE 450
accept TRUE 1900
accept FALSE 50
;
RUN;

PROC FREQ DATA=ex.ex6_5 ORDER=DATA;
    WEIGHT count;
    TABLES reject*TF;
RUN;
FREQ 프로시저
|
| ||||||||||||||||||||||||
EXAMPLE 6.6
PROC IML;
	use ex.ex6_4; read ALL;
 mean=1.29; se=0.89; n=17;
 LL=mean-1.96*se;
 UL=mean+1.96*se;

PRINT LL UL;
RUN;
QUIT;
| LL | UL |
|---|---|
| -0.4544 | 3.0344 |
EXAMPLE 6.7
PROC IMPORT DBMS=excel
		DATAFILE="C:\Biostat\data_chap06"
		OUT=ex.ex6_7 REPLACE;
		RANGE="exam6_7$";
RUN;

PROC IML;
use ex.ex6_7; read all;
xsum=sum(freq);
fxsum=sum(height#freq);
fxsum2=sum((height#height)#freq);
SS=fxsum2-((fxsum#fxsum)/70);
var=SS/69;
 print SS var;
RUN;
QUIT;

*도수다각형;
PROC SGPLOT DATA=ex.ex6_7;
keylegend / title=" " ;
series x= height y=freq ;
xaxis values=(62 to 78 by 1) label="Height, in inches(xi)"; yaxis values=(0 to 10 by 1) label="Frequency";
RUN;

*fig6.10;
DATA ex6_7c;
SET ex.ex6_7;
retain csum 0;
csum + freq;
rcsum=csum/70;
RUN;

PROC SGPLOT DATA=ex6_7c;
keylegend / title=" ";
series x=height y=csum / markers markerattrs=(symbol=circlefilled);
series x=height y=rcsum / y2axis transparency=1;
xaxis values=(62 to 78 by 2) label="X in inches";
yaxis values=(0 to 70 by 5) label="Cumulative Frequency";
y2axis values=(0 to 1 by 0.1) label="Cumulative Relative Frequency";
RUN;

*fig6.11;
DATA ex6_7pc;
set ex6_7c;
pcsum= rcsum*100;
RUN;

PROC SGPLOT DATA=ex6_7pc;
keylegend / title=" ";
scatter x= height y=pcsum / markerattrs=(symbol=circle);
xaxis values=(62 to 78 by 2) label="X in inches";
yaxis values=(0.01,0.1,1,5,10,20,30,40,50,60,70,80,90,95,99,99.1,99.99)
            label="Cumulative Relative Frequency in percent" labelattrs=(size=10pt);
RUN;
| SS | var |
|---|---|
| 755.94286 | 10.955694 |
교재: Biostatistical Analysis (5th Edition) by Jerrold H. Zar
**이 글은 22학년도 1학기 의학통계방법론 과제 자료들을 정리한 글 입니다.**
